| Tutorial | |||||
| 1. The type of input dataset | |||||
|
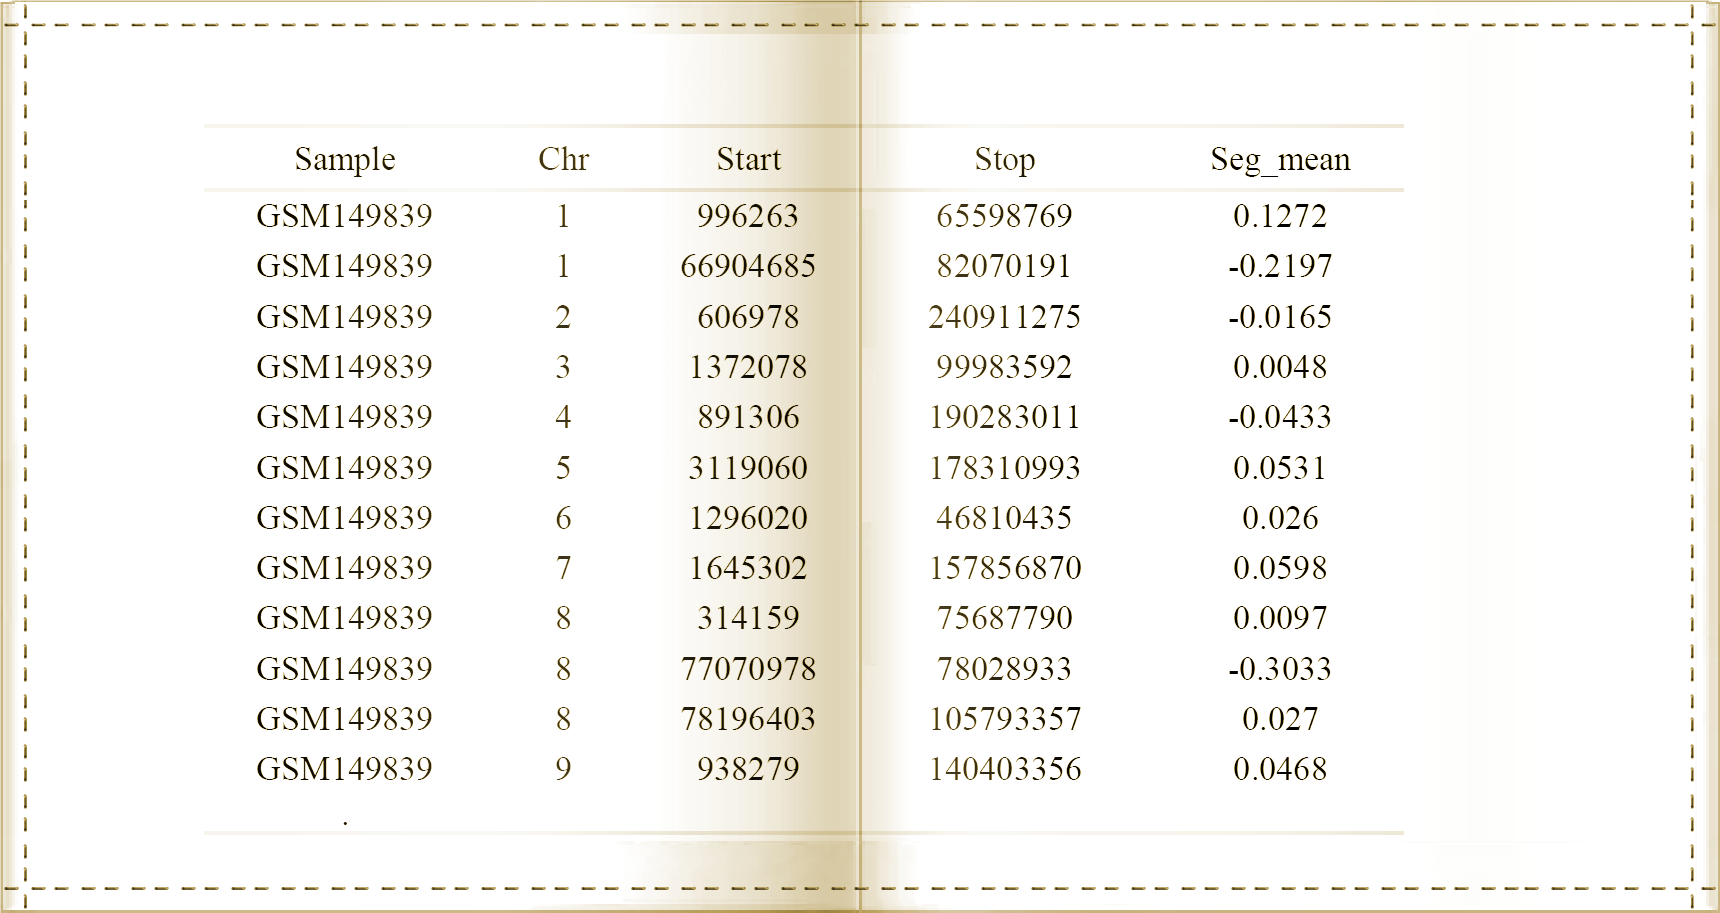
The detection of cervical cancer copy number variations(CNVs) is based on copy number segmentation data, which can be generated by array Comparative Genomic Hybridisation (aCGH) or Single Nucleotide Polymorphism (SNP) array platforms. Herein, The type of input data required include the sample ID, chromosome number, start and stop positions of each segment, and normailzed signal intersity. Uers can input sample name from GEO or TCGA. Table 1 indicates an example of the input sample format and content. |
|||||
Table 1. The sample content of input data.
|
|||||
| top | |||||
| 2. Query by sample ID | |||||
|
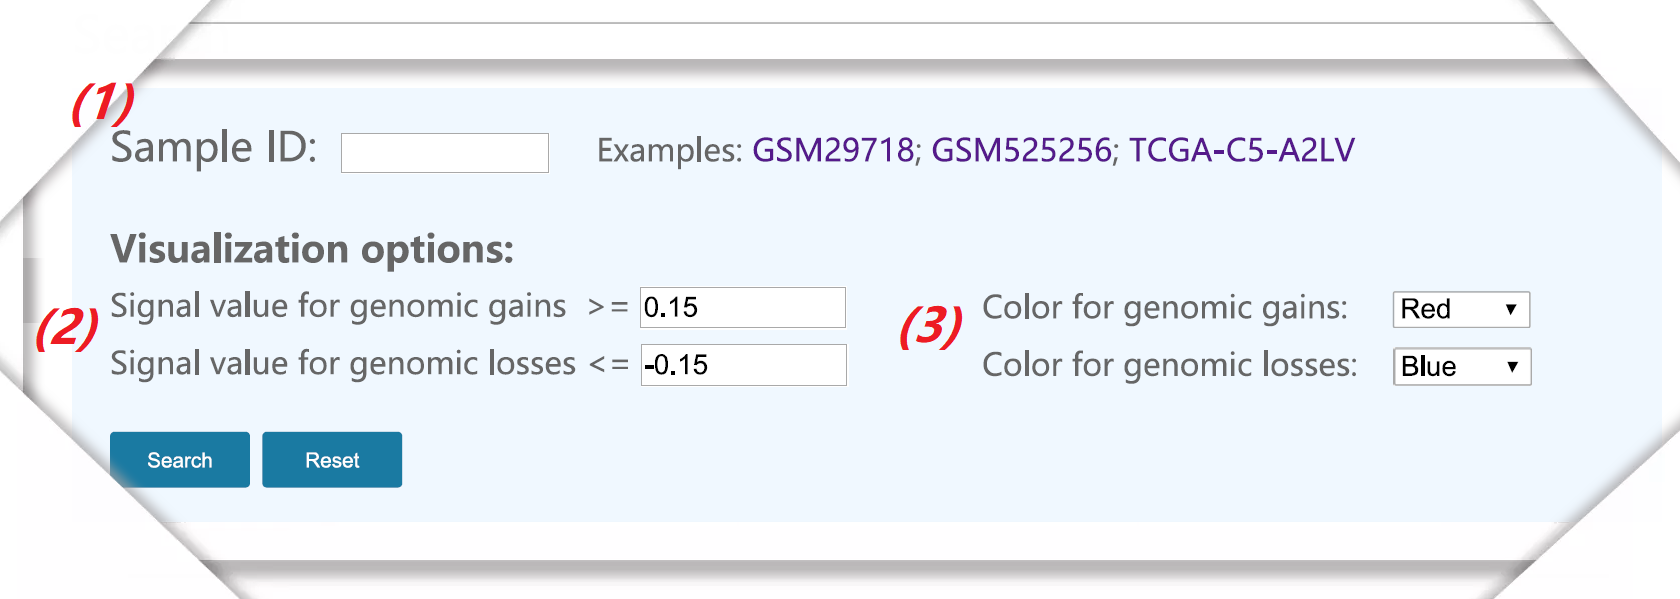
CNAdbCC contains about 1000 preprocessed cervical cancer CNVs samples . All data were collected from NCBI Gene Expression Omnibus (GEO) and The Cancer Genome Atlas (TCGA) databases. Uers can explore sample of interest in the search box on 'Search' page, and customize the threshold and color of copy number alterations. |
|||||
Figure 1. The interface of the sample data query. |
|||||
(1) Input sample ID to investigate the CNVs of the specific sample. All study can view on 'Browse' page. |
|||||
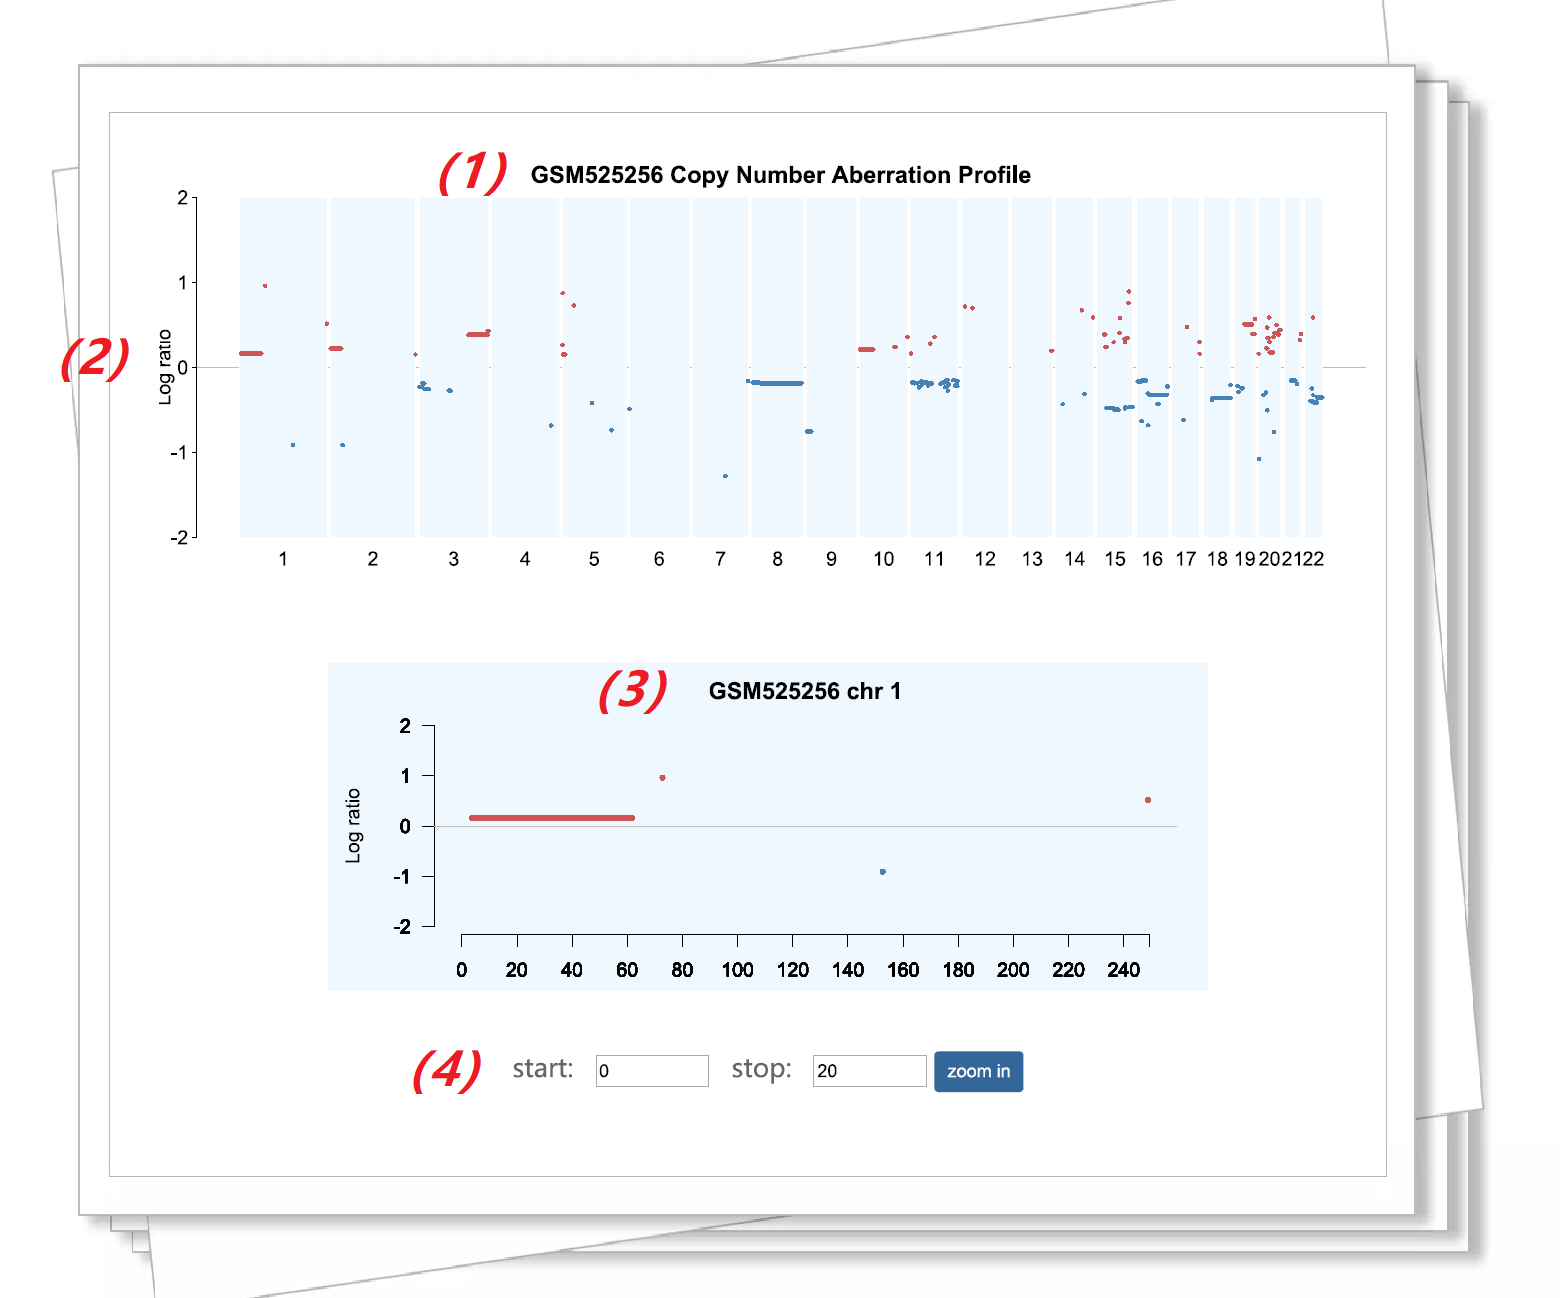
Figure 2. An example of sample data query result. |
|||||
(1) Received the sample name. |
|||||
| top | |||||
| 3. Query by gene symbol | |||||
|
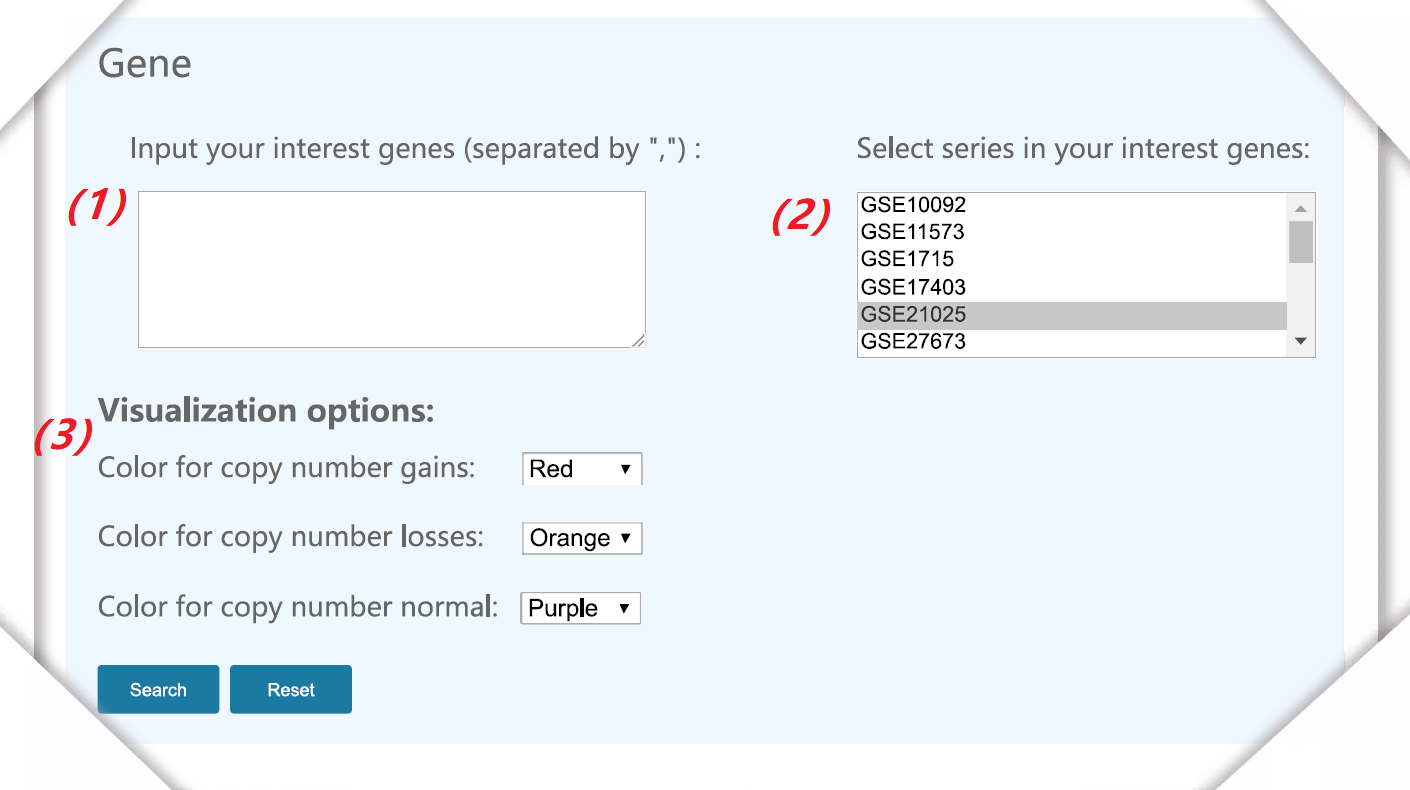
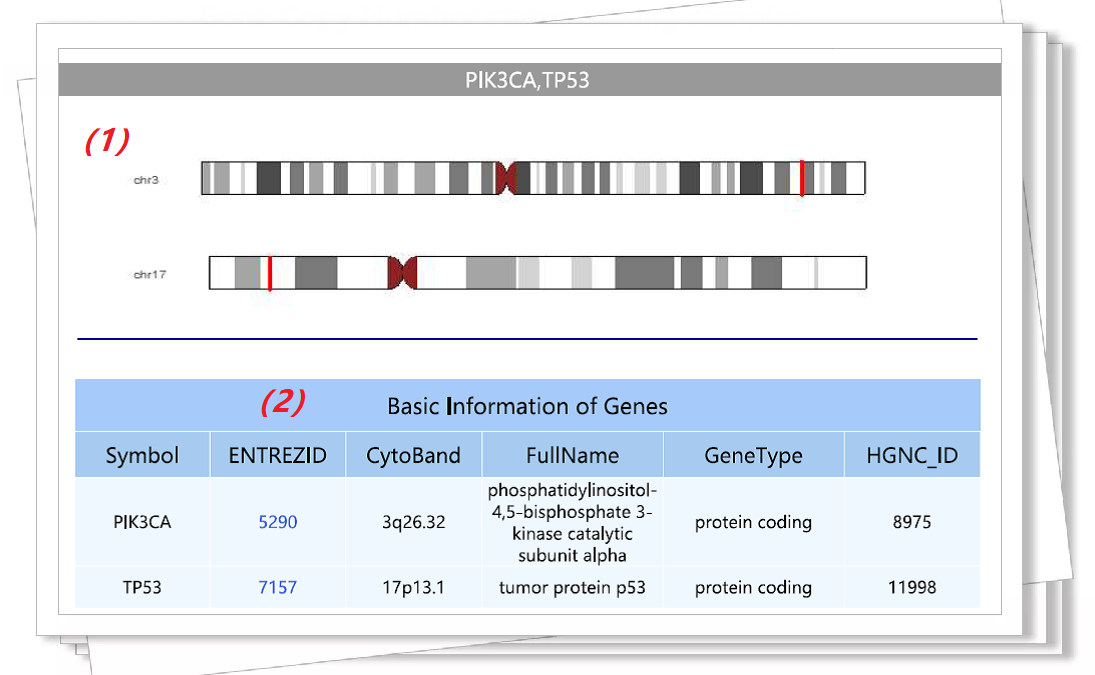
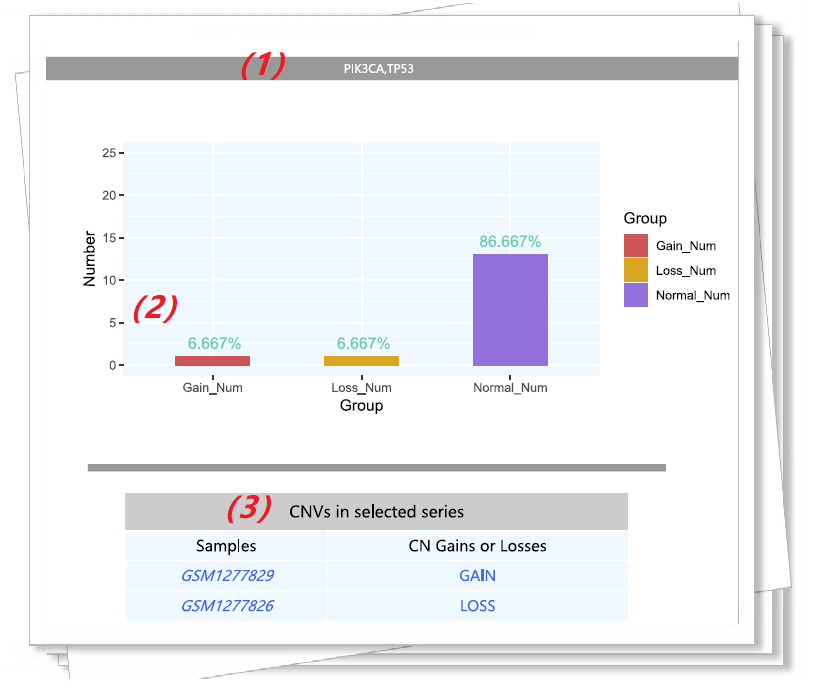
By querying a specific gene name, uers can investigate the copy number alterations of gains, losses and normal in the whole samples, respectively. Then, specific gene aberration information are obtioned for subsequent analysis, |
|||||
Figure 3. The interface of gene data query. |
|||||
(1) Input gene symbol (eg: PIK3CA, EP300). |
|||||
Figure 4. An example of gene symbol query result. |
|||||
(1) Diagram of genes on chromosomes. |
|||||
Figure 5. An example of gene symbol query result. |
|||||
(1) The gene symbol of the user entered. |
|||||
| top | |||||
| 4. Query study by Browse table | |||||
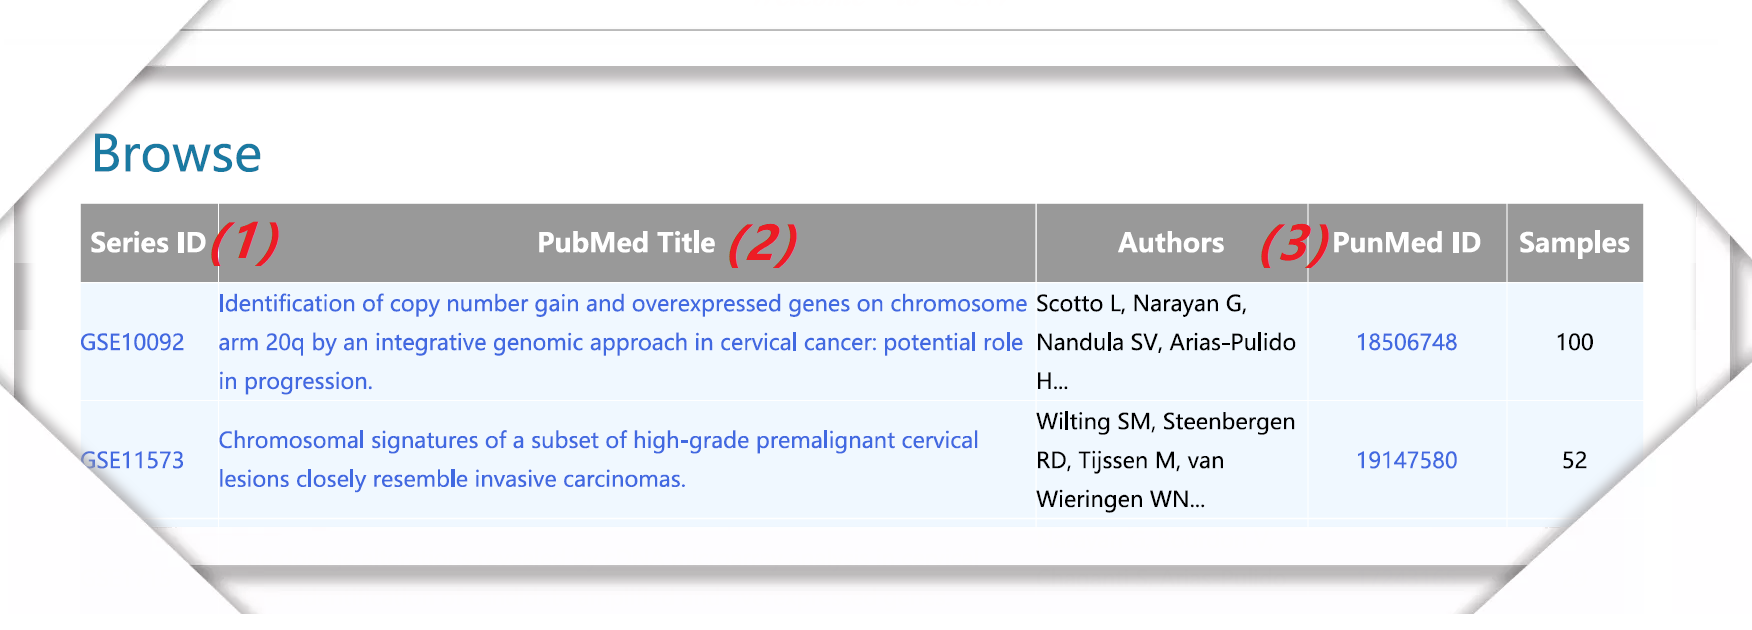
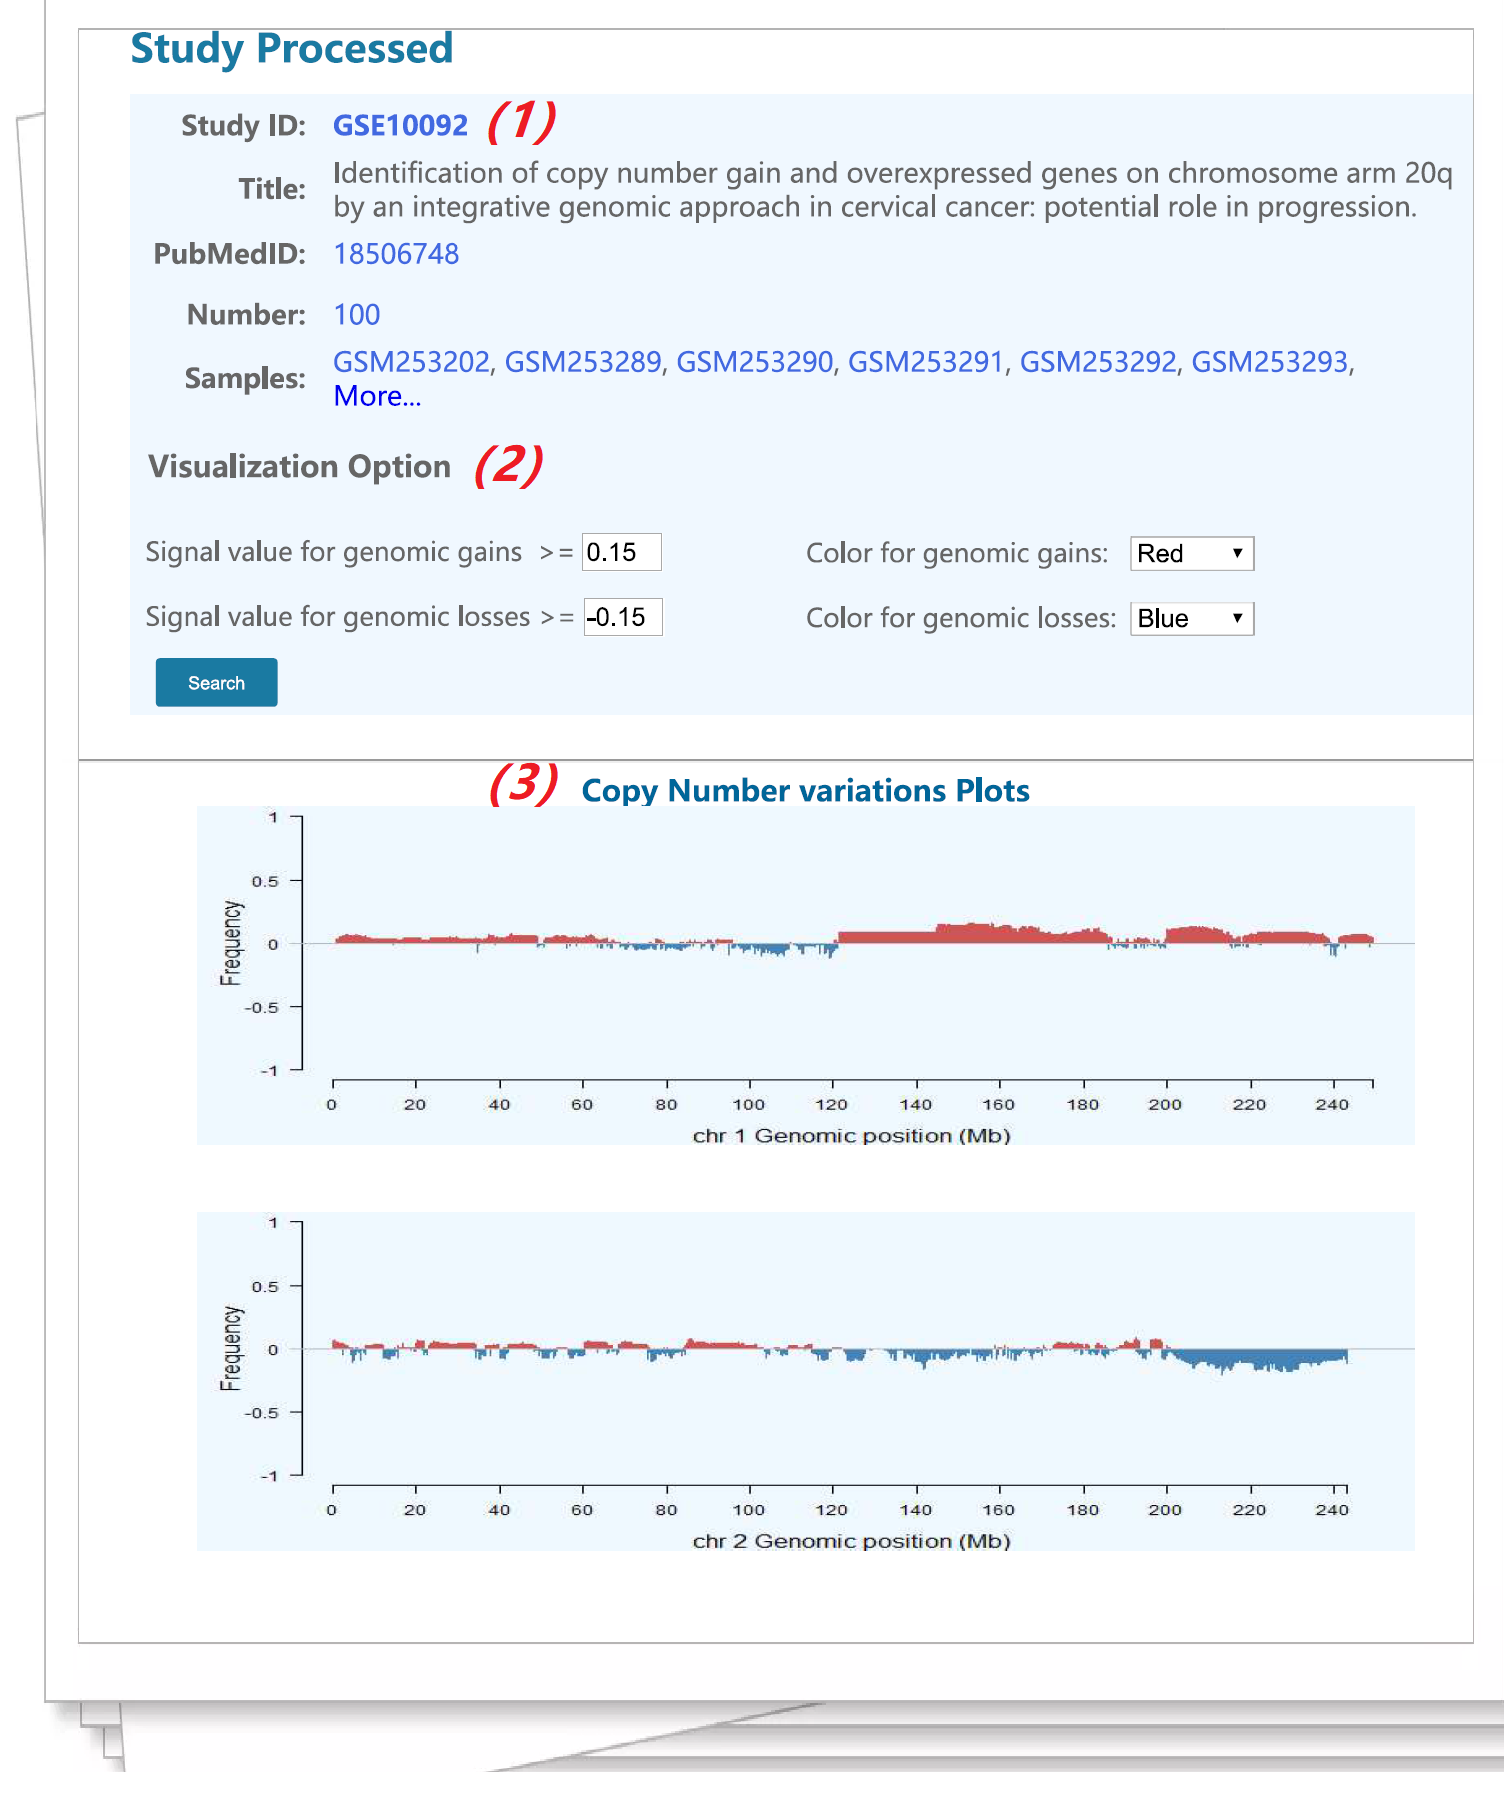
There are 16 preprocessed GEO or TCGA data series integrated into CNAdbCC. Click on the study title and the related genomic alteration data will be displayed, include corresponding sample information, author information, article report and sample quantity. |
|||||
Figure 6. The interface of study query and information. |
|||||
(1) The series name, click it, will connect to the GEO databaes. |
|||||
Figure 7. An example of the study data visualization interface |
|||||
(1) The general information of the selected data series. |
|||||
| top | |||||
| Cervical cancer copy number aberrations database. 2025 Cai Laboratory | |||||
