| MethCNA: a database for integrating genomic and epigenomic data in cancer | ||||||||
| Home | Search | Browse | Cluster | Tutorial | Contact | |||
| Tutorial | ||||
| 1. Sample-level data query | ||||
|
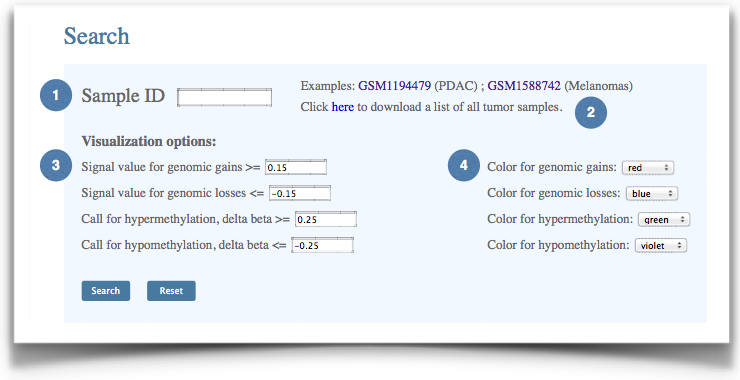
MethCNA contains about 10,000 preprocessed tumor samples representing 37 cancer types. All data were collected from NCBI Gene Expression Omnibus (GEO) and The Cancer Genome Atlas (TCGA) databases. The sample ID can be inputted by users to explore data of interest. |
|||
|
Figure 1. The interface of sample-level data query. |
|||
|
(1) Input GEO sample ID to investigate the genomic and epigenomic alterations of specific tumor sample. |
|||
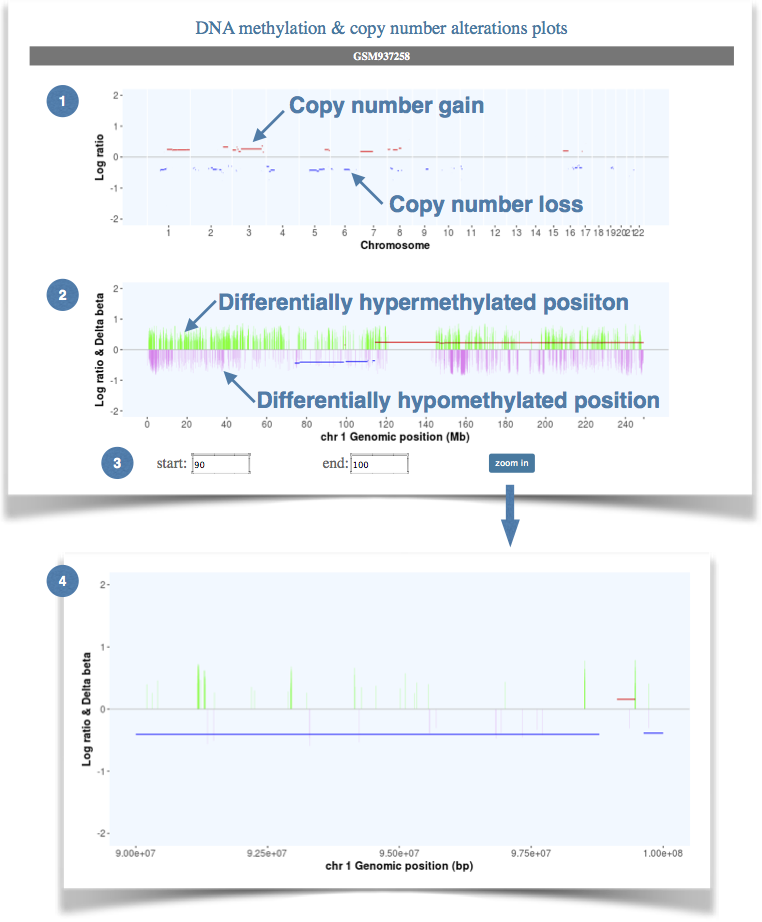
Figure 2. The genomic and epigenomic alterations of each chromosome. |
||||
(1) The general view of copy number alterations for the whole genome. |
||||
| top | ||||
| 2. Gene-level data query | ||||
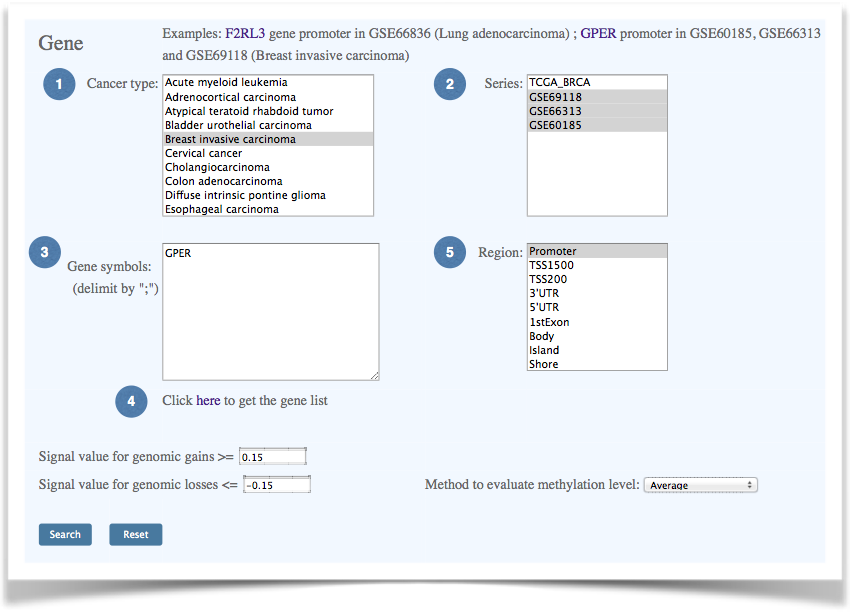
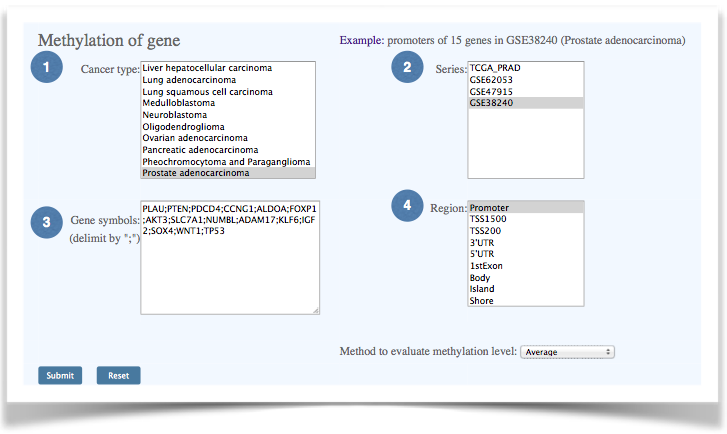
| Gene-level data query allows users access to gene-specific aberration information in selected datasets. Cancer types and data series can be chosen in the list box, and multiple gene names can be specified separated with a semicolon. There are seven gene regions and four CpG island (CGI) regions that can be selected for analysis. | ||||
Figure 3. The interface of Gene-level data query. |
||||
(1) Select a cancer type. |
||||
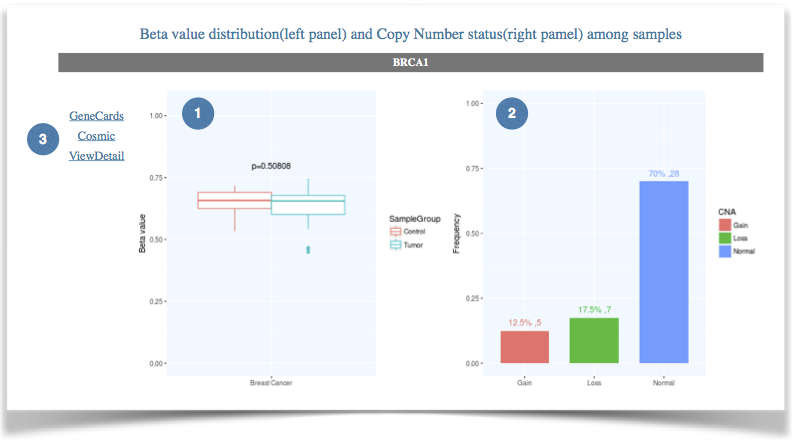
Figure 4. The results of gene-level data query. |
||||
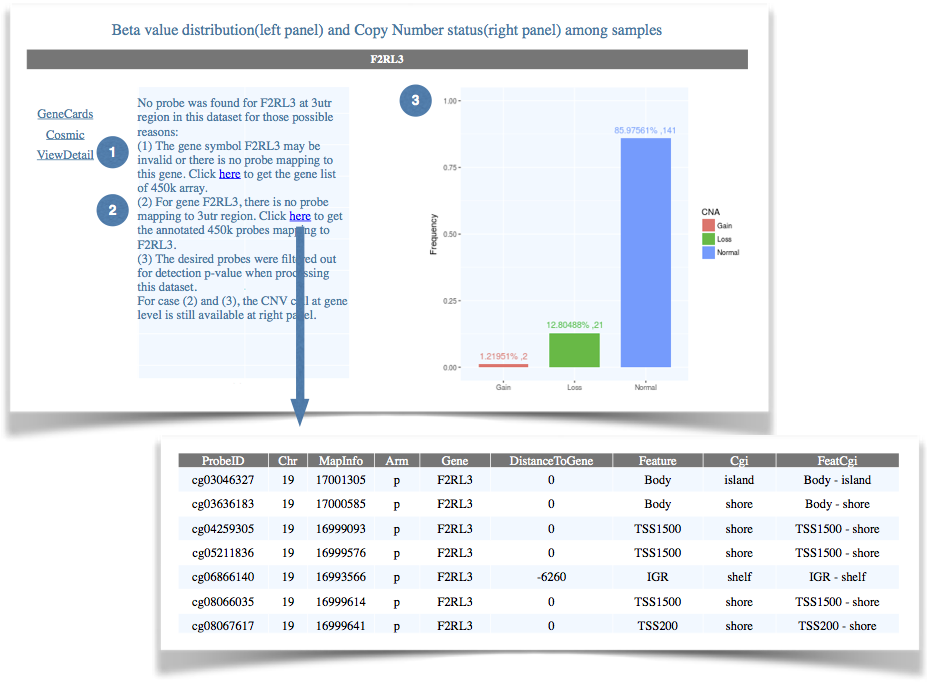
(1) The Beta value distribution of queried gene in different groups. |
||||
| If the web interface does not return the beta value distribution of queried gene, there are three possible reasons: | ||||
Figure 5. Pinpoint the problem that no probe is mapping to a specific gene. |
||||
| (1) The gene symbol is invalid or there is no probe representing this gene on the 450k array. In this way, users can click on the hyperlink to check the complete gene list of 450k array, and to check whether there are probes mapping to a specific gene. (2) For a given gene, there is no probe covering the queried region. In this way, users can click on the hyperlink to obtain a detailed annotation of all probes mapping to the input gene, and to check whether there are probes mapping to specific regions of the gene. (3) The desired probes were filtered out from the queried dataset due to poor quality. In this way, although the probe-level data is not available, the CNA data at gene-level will still be displayed if available. |
||||
| top | ||||
| 3. Public data browsing | ||||
There are more than 50 preprocessed GEO or TCGA data series integrated into MethCNA. Click on the study title and the related genomic and epigenomic alteration data will be displayed. |
||||
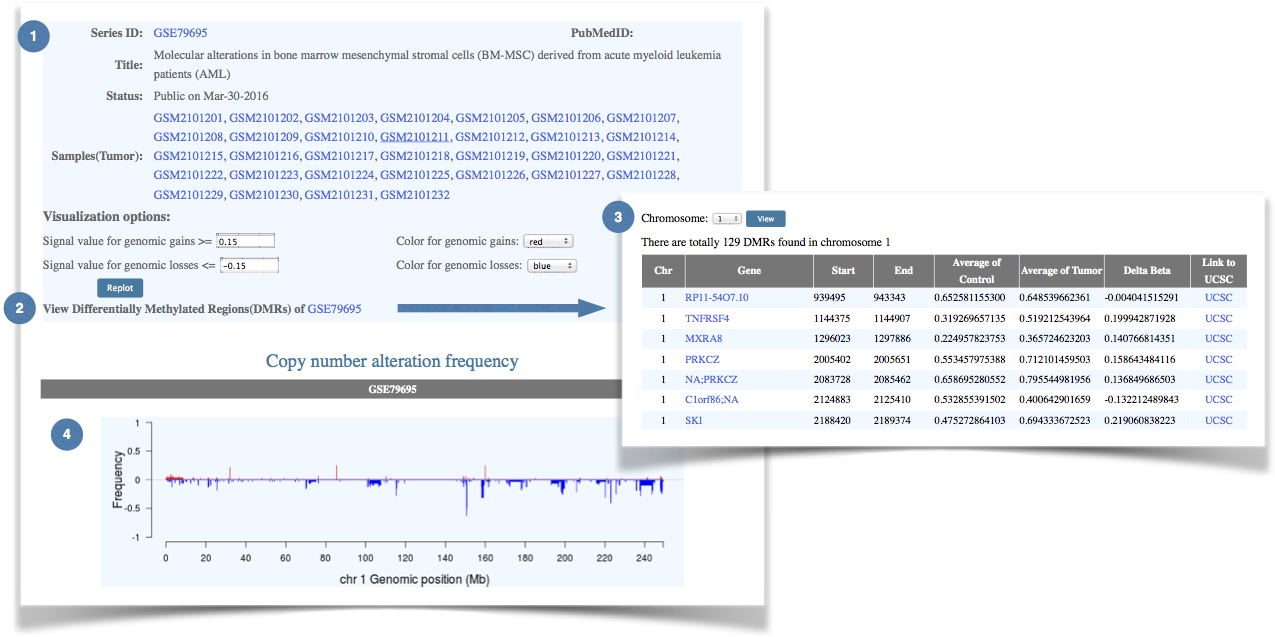
Figure 6. An example of the GEO data visualization interface. |
||||
(1) The general information of the selected data series. |
||||
| top | ||||
| 4. Data clustering | ||||
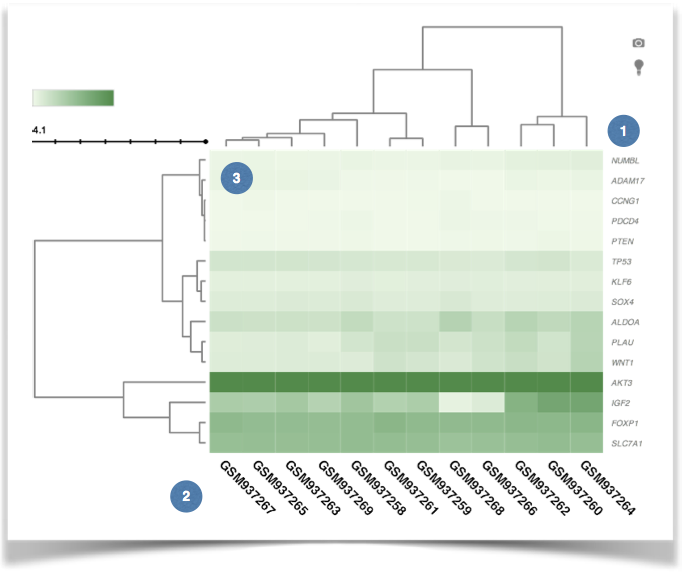
4.1 Methylation data clustering The hierarchical clustering heatmap shows the DNA methylation patterns. Gene-level DNA methylation data clustering can be performed. The NCBI Reference Sequence gene annotation and UCSC Genome Browser are used to define gene functional regions and CpG island regions. The Euclidean distance was used for hierarchical clustering of samples. |
||||
Figure 7. The interface of gene-level DNA methylation data clustering. |
||||
| (1) Select a cancer type. (2) Select data series. The multiple selection list box shows available series IDs for the selected cancer type. (3) Input gene symbols. Multiple gene symbols can be provided and separated by comma. (4) Gene-centric and CpG island regions selection. The NCBI Reference Sequence gene annotation and UCSC Genome Browser are used to define gene functional regions and CpG island regions. |
||||
Figure 8. The hierarchical clustering of DNA methylation data. |
||||
(1) The list of input genes. |
||||
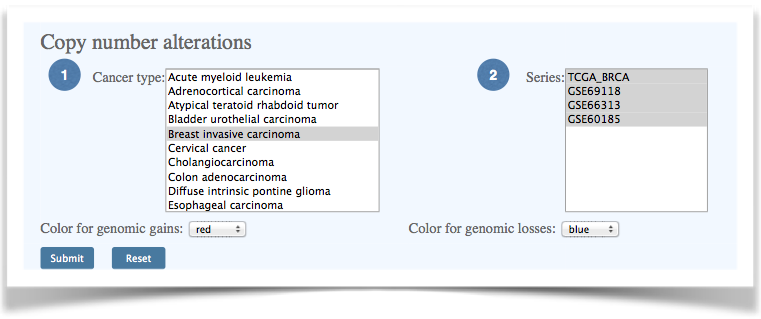
| 4.2 Frequency plot of copy number alteration | ||||
Figure 9. Selection of cancer type and dataset for copy number alteration frequency analysis. |
||||
| (1) Select a cancer type. The standard cancer names are obtained from International Classification of Diseases for Oncology, 3rd Edition (ICD-O-3). For TCGA data, the TCGA tumor-type abbreviations are provided. (2) Select data series. The multiple selection list box shows available series IDs for the selected cancer type. |
||||
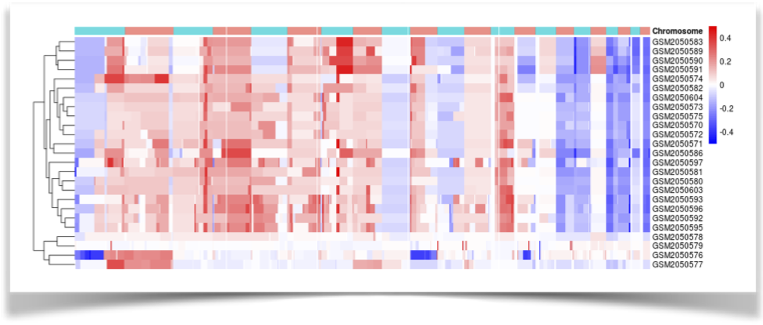
Figure 10. The hierarchical clustering of DNA copy number alterations. |
||||
|
||||
| top | ||||
| © 2017 Cai Laboratory. Last updated on 30 December 2017 | |||||||||