| Full name: ATPase H+ transporting V1 subunit G3 | Alias Symbol: ATP6G3|Vma10 | ||
| Type: protein-coding gene | Cytoband: 1q31.3 | ||
| Entrez ID: 127124 | HGNC ID: HGNC:18265 | Ensembl Gene: ENSG00000151418 | OMIM ID: 618071 |
ATP6V1G3 involved pathways:
| KEGG pathway | Description | View |
|---|---|---|
| hsa04150 | mTOR signaling pathway | |
| hsa05110 | Vibrio cholerae infection | |
| hsa05120 | Epithelial cell signaling in Helicobacter pylori infection |
Expression of ATP6V1G3:
| Dataset | Gene | EntrezID | Probe | Log2FC | Adj.pValue | Expression |
|---|---|---|---|---|---|---|
| GSE17351 | ATP6V1G3 | 127124 | 230565_at | 0.0261 | 0.9336 | |
| GSE26886 | ATP6V1G3 | 127124 | 230565_at | 0.1190 | 0.3077 | |
| GSE45670 | ATP6V1G3 | 127124 | 230565_at | 0.1401 | 0.1477 | |
| GSE53622 | ATP6V1G3 | 127124 | 43378 | 0.3858 | 0.0004 | |
| GSE53624 | ATP6V1G3 | 127124 | 43378 | 0.6422 | 0.0000 | |
| GSE63941 | ATP6V1G3 | 127124 | 230565_at | -0.1219 | 0.4883 | |
| GSE77861 | ATP6V1G3 | 127124 | 230565_at | -0.0377 | 0.6851 |
Upregulated datasets: 0; Downregulated datasets: 0.
Survival by ATP6V1G3 expression:
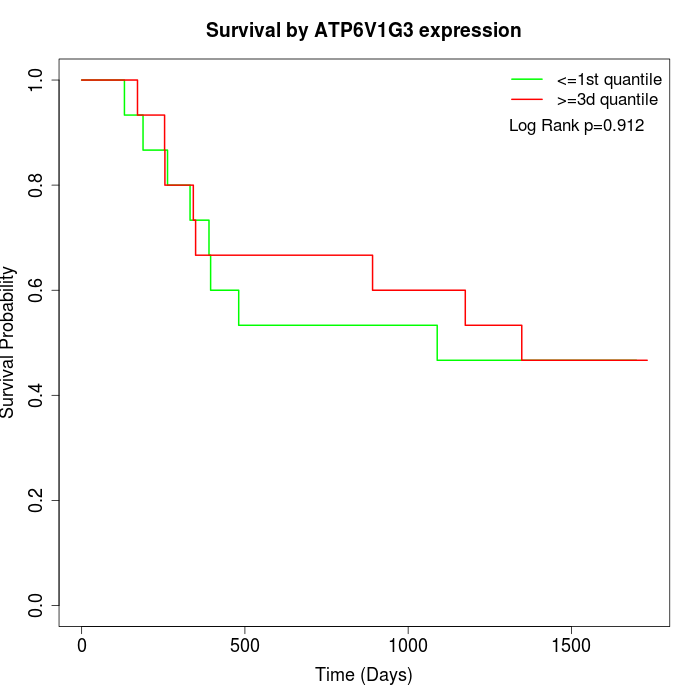 | 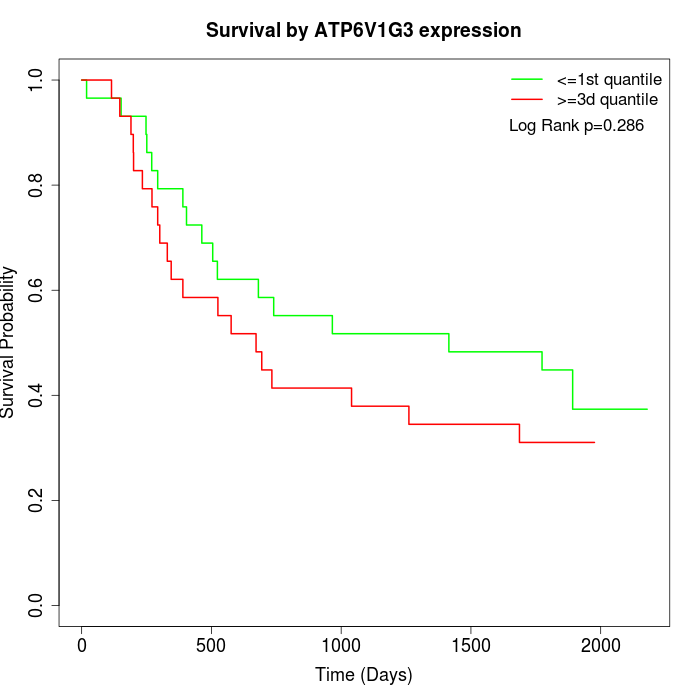 | 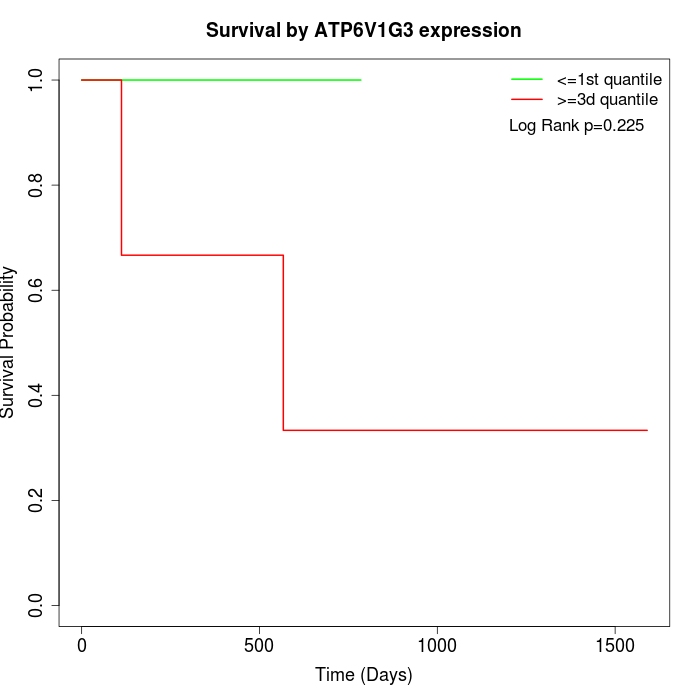 |
| GSE53622 | GSE53624 | TCGA |
Note: Click image to view full size file.
Copy number change of ATP6V1G3:
| Dataset | Gene | EntrezID | Gain | Loss | Normal | Detail |
|---|---|---|---|---|---|---|
| GSE15526 | ATP6V1G3 | 127124 | 7 | 0 | 23 | |
| GSE20123 | ATP6V1G3 | 127124 | 7 | 0 | 23 | |
| GSE43470 | ATP6V1G3 | 127124 | 7 | 0 | 36 | |
| GSE46452 | ATP6V1G3 | 127124 | 3 | 1 | 55 | |
| GSE47630 | ATP6V1G3 | 127124 | 14 | 0 | 26 | |
| GSE54993 | ATP6V1G3 | 127124 | 0 | 6 | 64 | |
| GSE54994 | ATP6V1G3 | 127124 | 15 | 0 | 38 | |
| GSE60625 | ATP6V1G3 | 127124 | 0 | 0 | 11 | |
| GSE74703 | ATP6V1G3 | 127124 | 7 | 0 | 29 | |
| GSE74704 | ATP6V1G3 | 127124 | 2 | 0 | 18 | |
| TCGA | ATP6V1G3 | 127124 | 43 | 5 | 48 |
Total number of gains: 105; Total number of losses: 12; Total Number of normals: 371.
Somatic mutations of ATP6V1G3:
Generating mutation plots.
Highly correlated genes for ATP6V1G3:
Showing all 1 correlated genes with mean PCC>0.5.
| Gene1 | Gene2 | Mean PCC | Num. Datasets | Num. PCC<0 | Num. PCC>0.5 |
|---|---|---|---|---|---|
| ATP6V1G3 | KRTAP4-9 | 0.517288 | 4 | 0 | 3 |
For details and further investigation, click here