Significant peaks from GISTIC2.0 analysis based on 11 datasets
Select a peak to view affected genes:
Select CNV type:
; Select peak:
.
*Click on the image to view high resolution image.
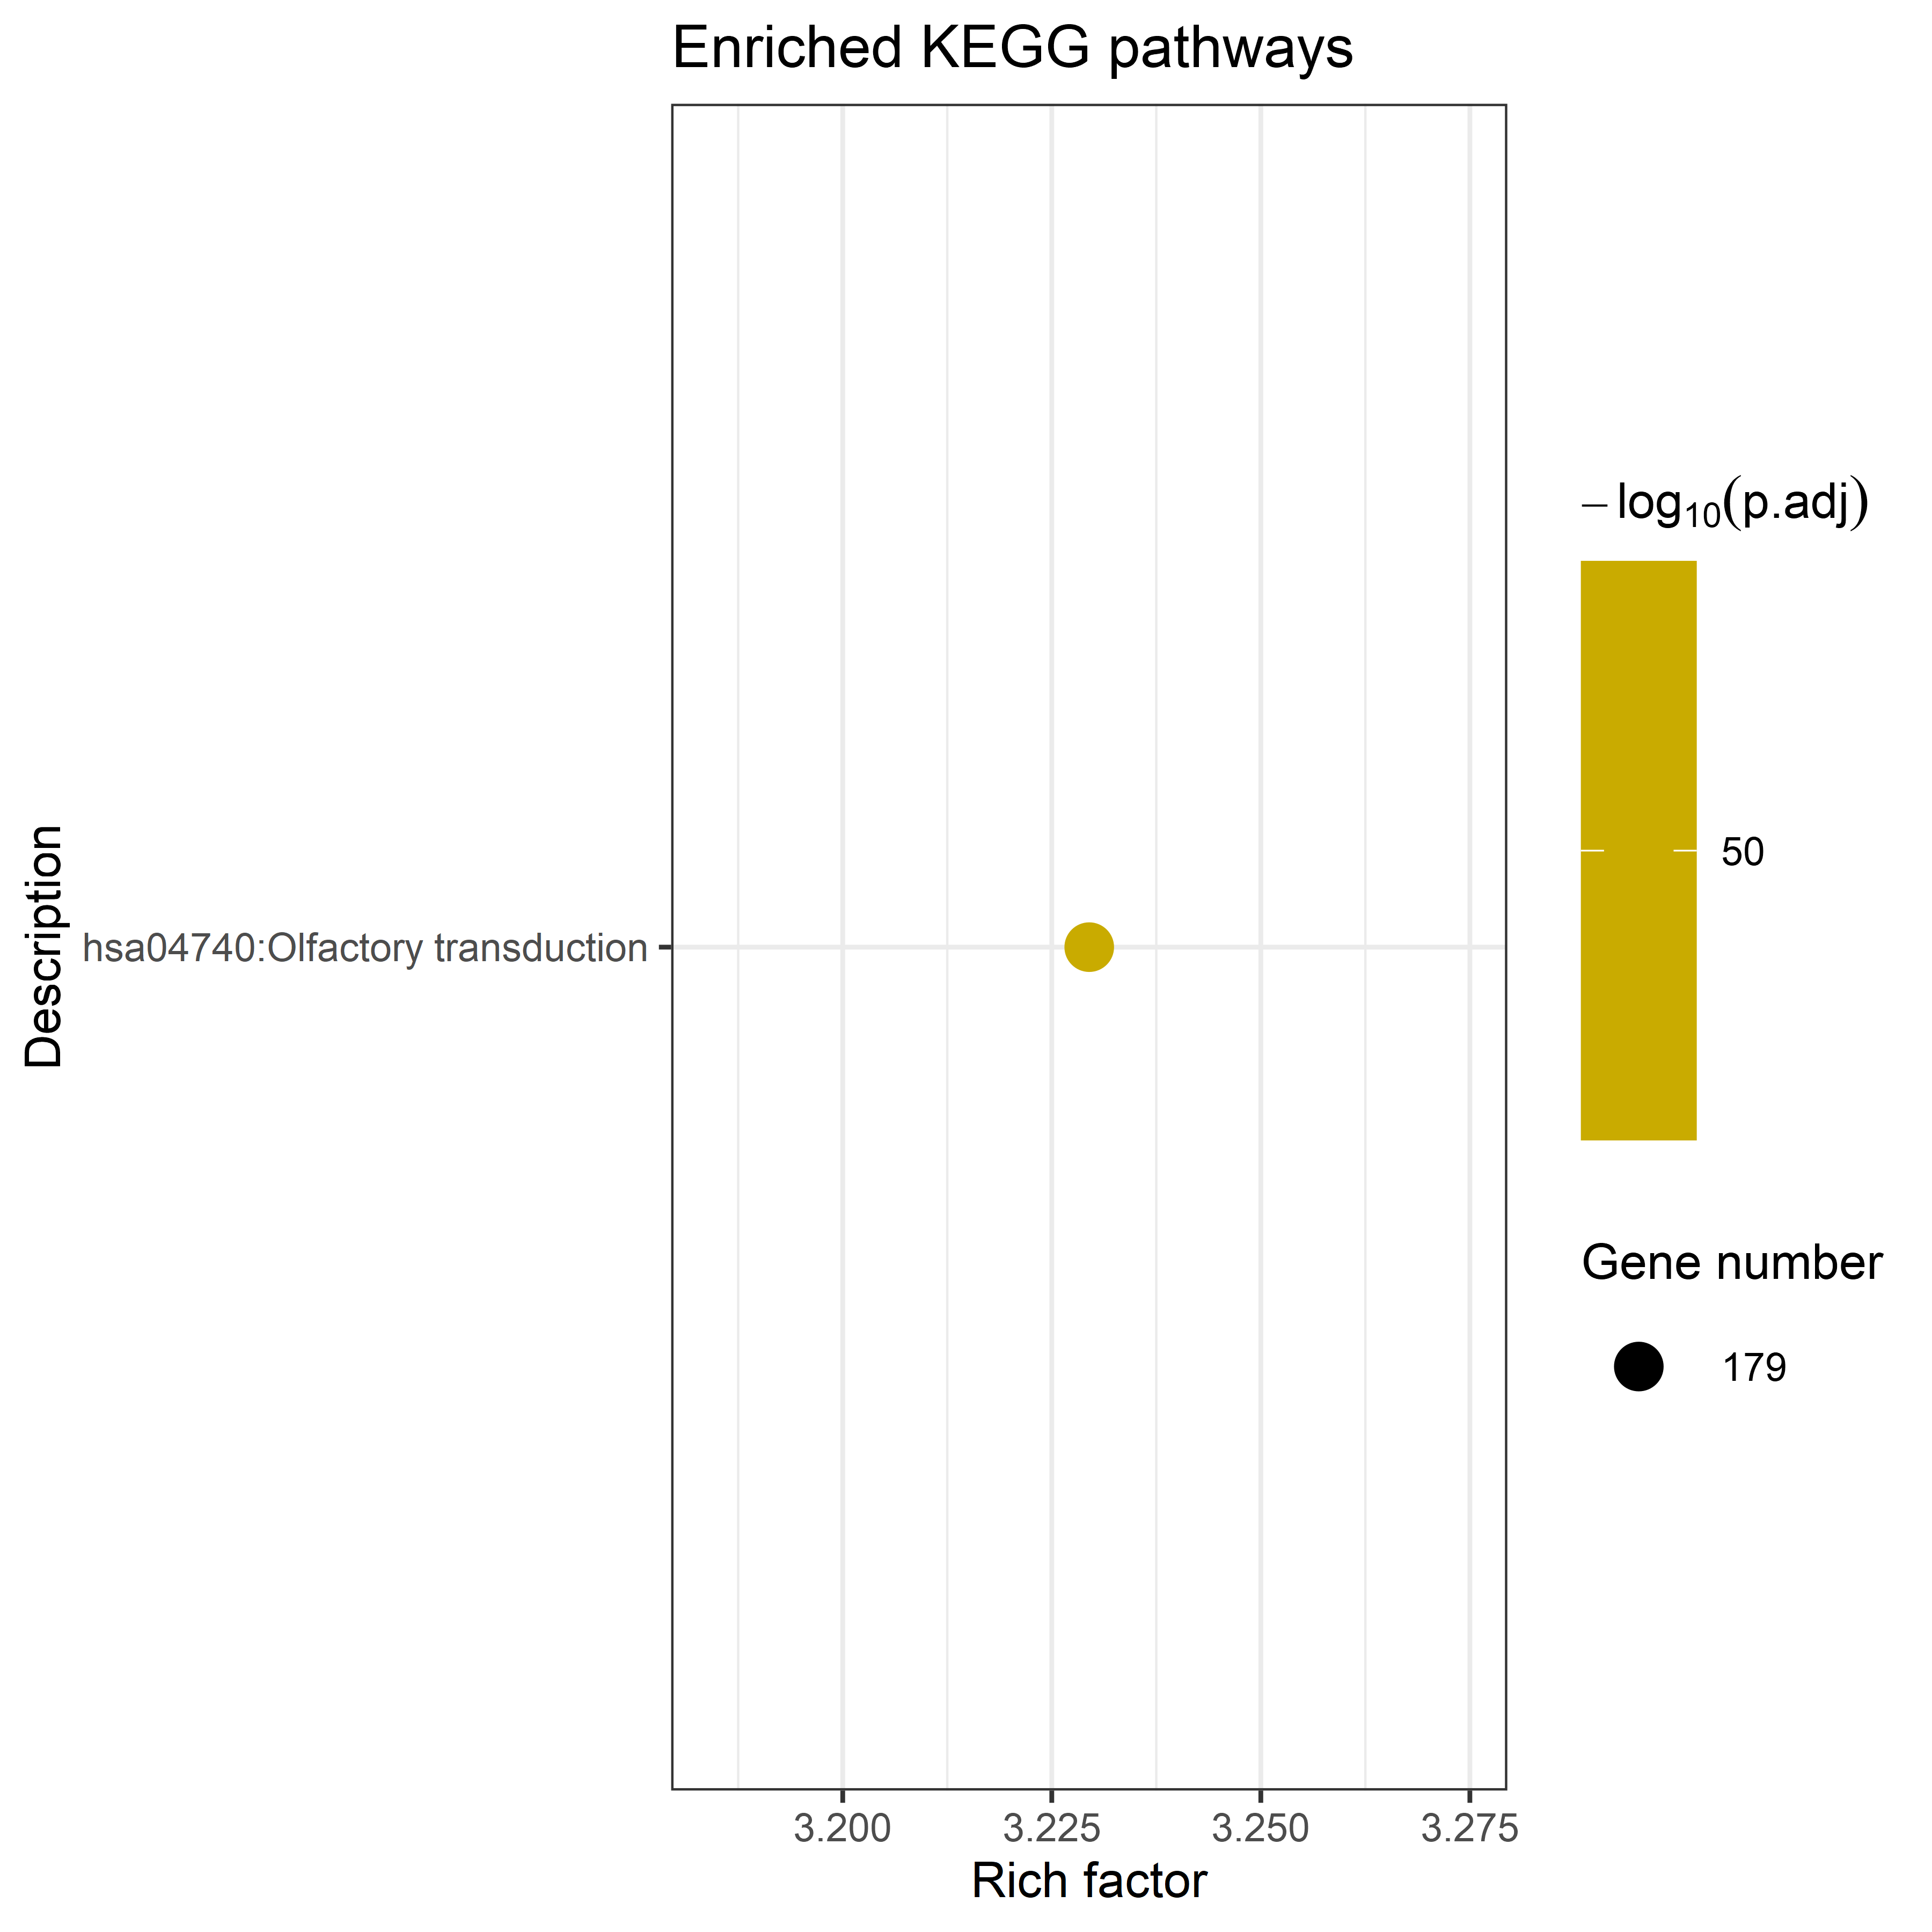
KEGG and Reactome enrichment of genes in significantly amplified peaks
![](http://cailab.labshare.cn/ESCCdb/application/SNV_CNV_dat/cnv/cnv_amp_enrich_KEGG.png) | ![](http://cailab.labshare.cn/ESCCdb/application/SNV_CNV_dat/cnv/cnv_amp_enrich_Reactome.png) |
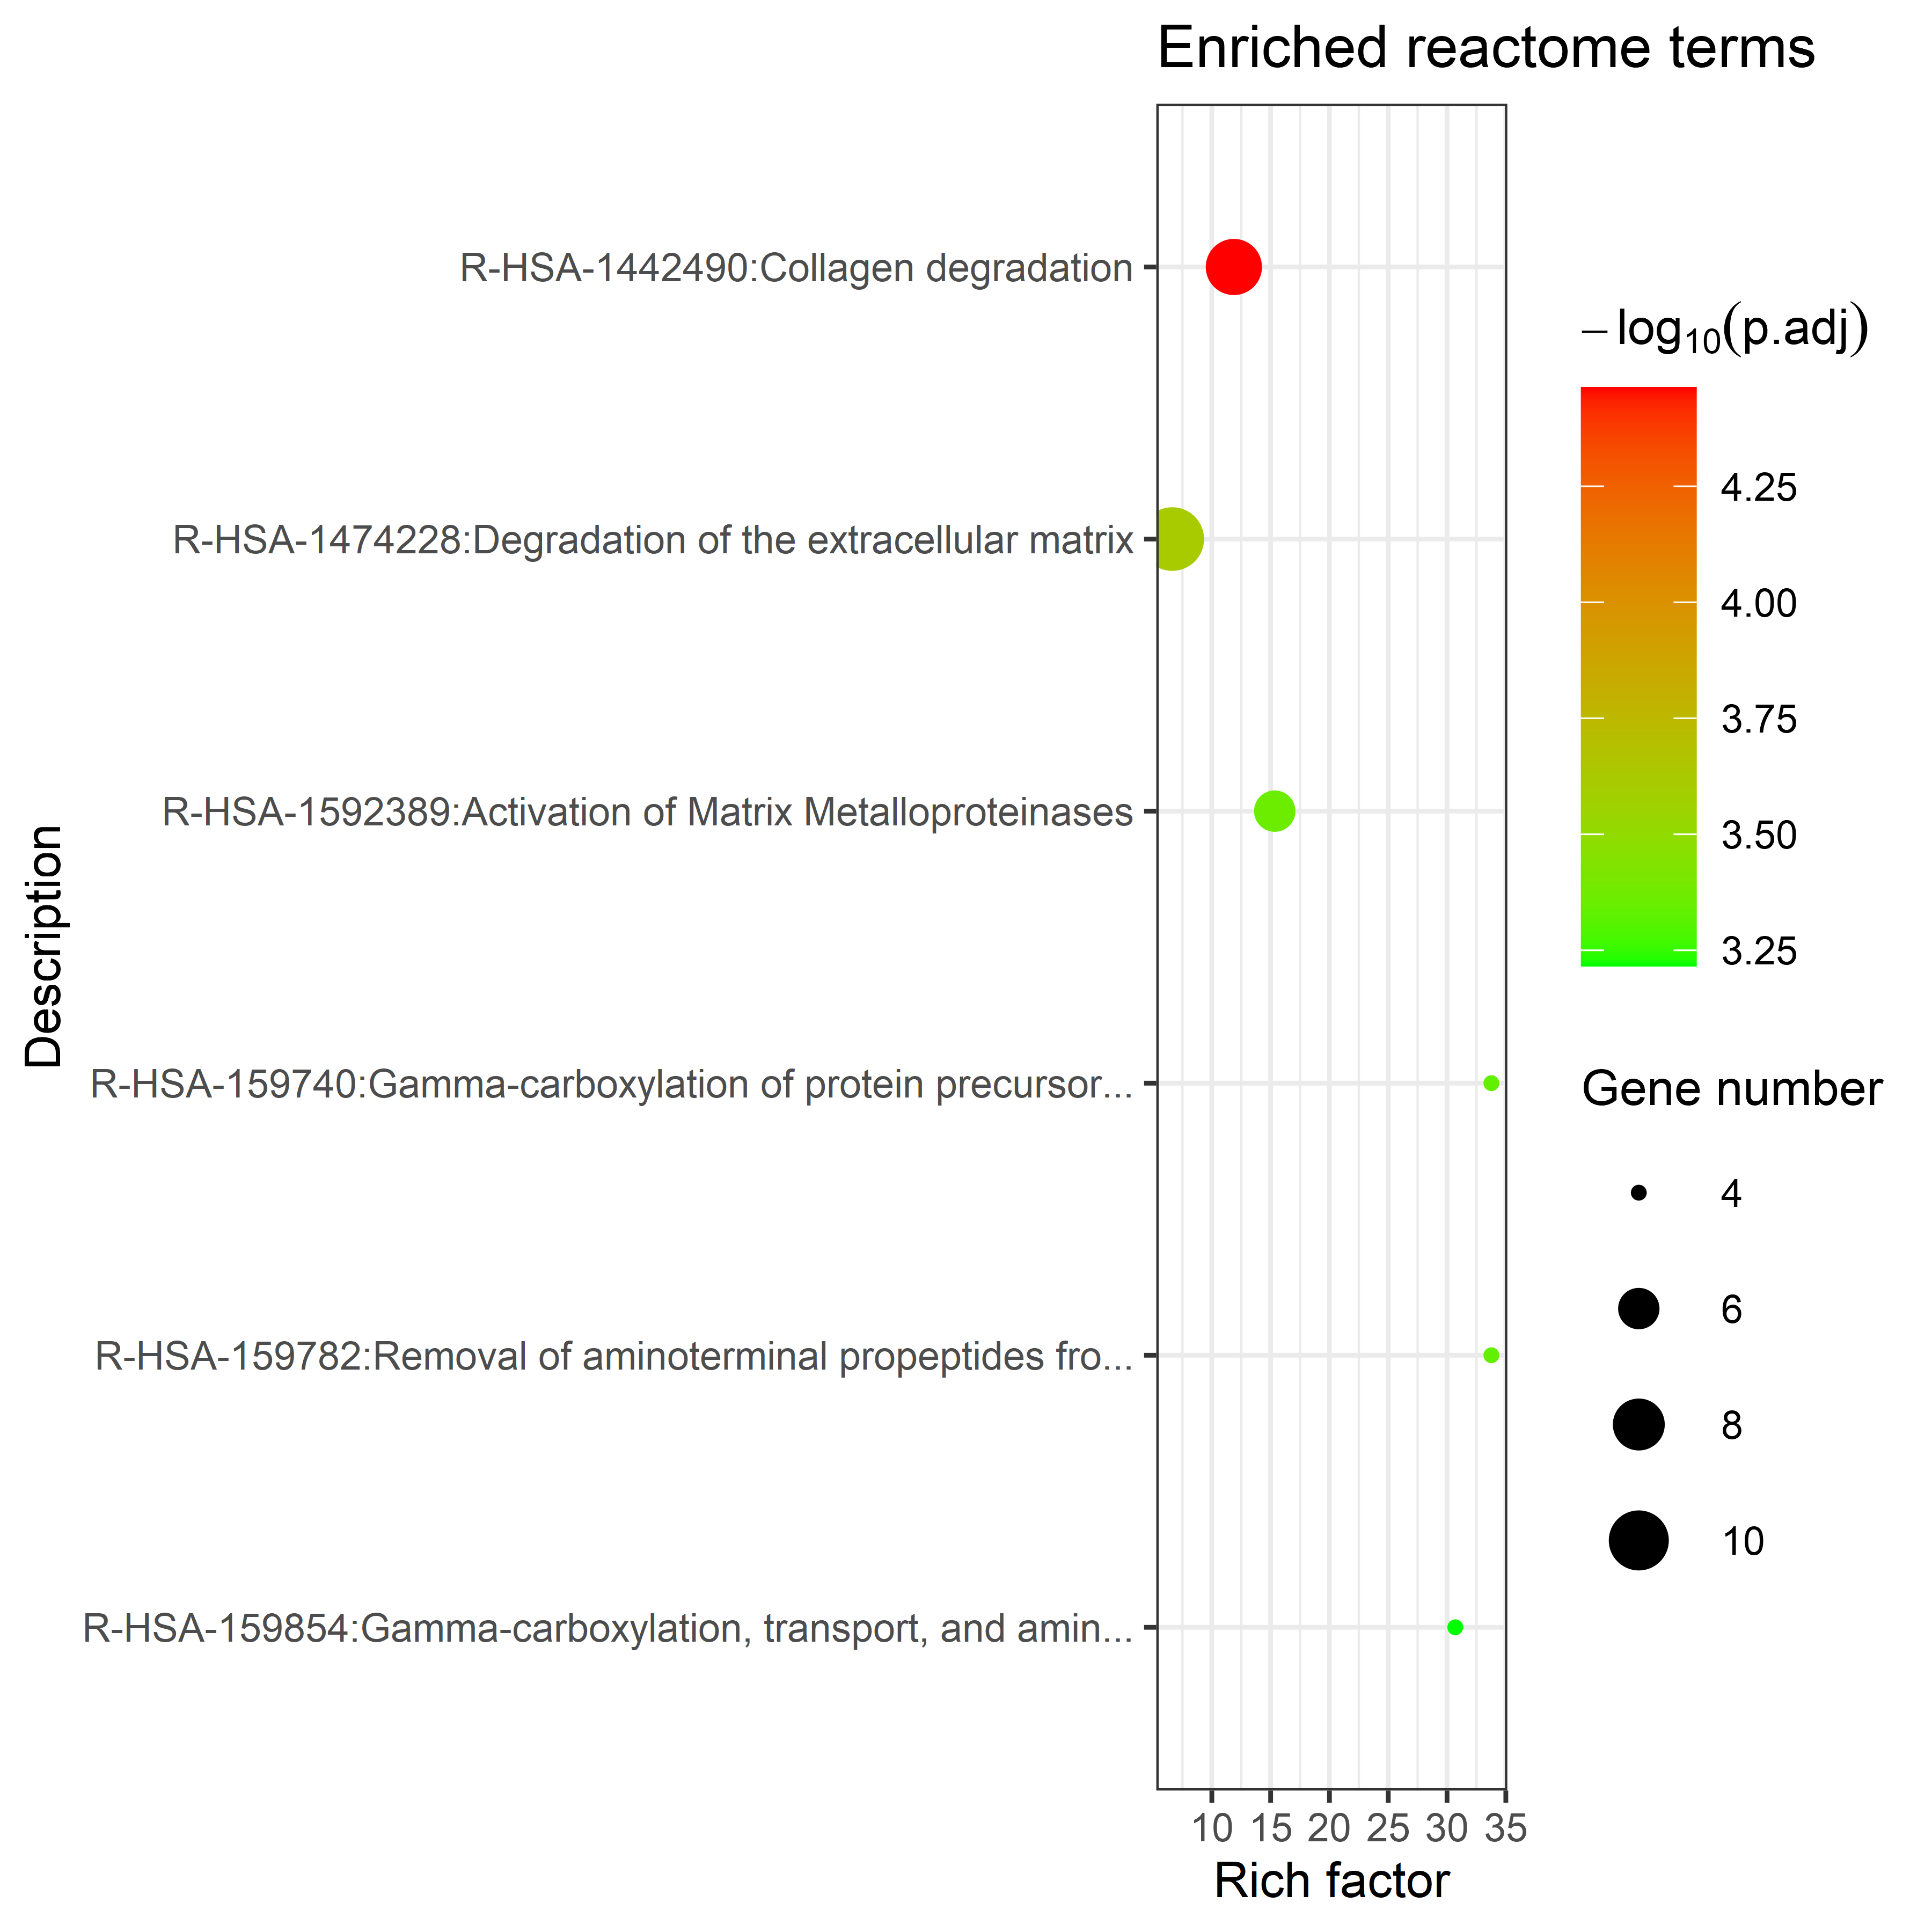
KEGG and Reactome enrichment of genes in significantly deleted peaks
![](http://cailab.labshare.cn/ESCCdb/application/SNV_CNV_dat/cnv/cnv_del_enrich_KEGG.png) | ![](http://cailab.labshare.cn/ESCCdb/application/SNV_CNV_dat/cnv/cnv_del_enrich_Reactome.png) |