| Full name: cytochrome P450 family 51 subfamily A member 1 | Alias Symbol: CP51|CYPL1|P450L1|LDM|P450-14DM | ||
| Type: protein-coding gene | Cytoband: 7q21.2 | ||
| Entrez ID: 1595 | HGNC ID: HGNC:2649 | Ensembl Gene: ENSG00000001630 | OMIM ID: 601637 |
| Related drugs: AZALANSTAT, FLUCONAZOLE... [more] | |||
Expression of CYP51A1:
| Dataset | Gene | EntrezID | Probe | Log2FC | Adj.pValue | Expression |
|---|---|---|---|---|---|---|
| GSE53622 | CYP51A1 | 1595 | 20561 | -0.0152 | 0.8914 | |
| GSE53624 | CYP51A1 | 1595 | 20561 | -0.0841 | 0.3767 | |
| GSE97050 | CYP51A1 | 1595 | A_24_P130041 | -0.1076 | 0.7560 | |
| SRP007169 | CYP51A1 | 1595 | RNAseq | -0.6671 | 0.1170 | |
| SRP008496 | CYP51A1 | 1595 | RNAseq | -0.6795 | 0.0217 | |
| SRP064894 | CYP51A1 | 1595 | RNAseq | -0.5707 | 0.0047 | |
| SRP133303 | CYP51A1 | 1595 | RNAseq | 0.5143 | 0.1029 | |
| SRP159526 | CYP51A1 | 1595 | RNAseq | 0.1762 | 0.7194 | |
| SRP193095 | CYP51A1 | 1595 | RNAseq | -0.0020 | 0.9931 | |
| SRP219564 | CYP51A1 | 1595 | RNAseq | 0.0658 | 0.8691 | |
| TCGA | CYP51A1 | 1595 | RNAseq | 0.0592 | 0.4251 |
Upregulated datasets: 0; Downregulated datasets: 0.
Survival by CYP51A1 expression:
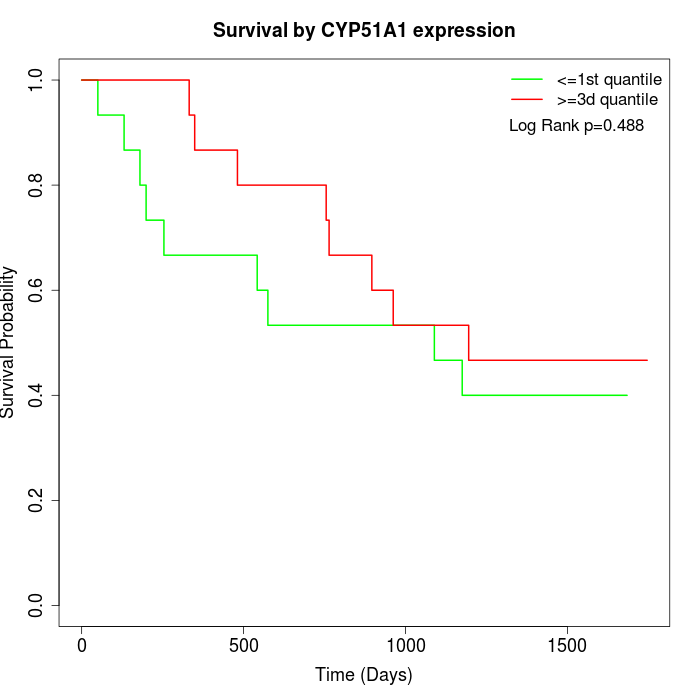 | 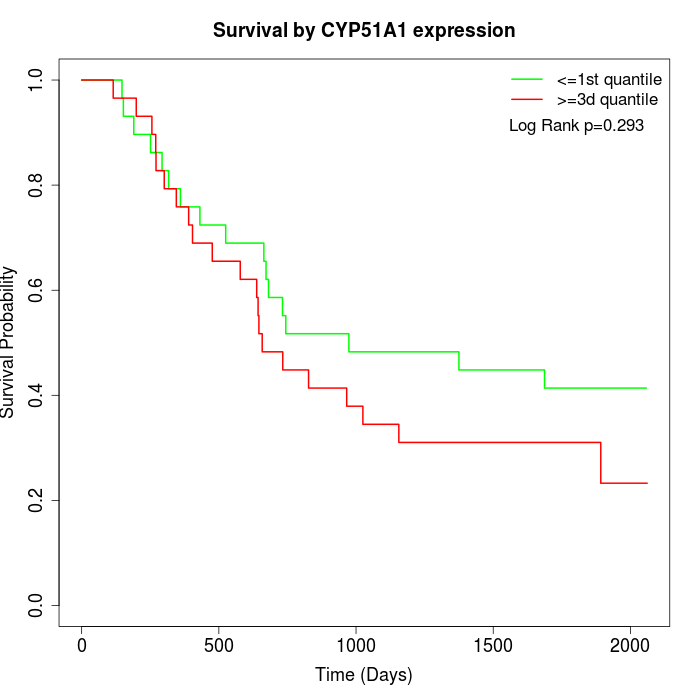 | 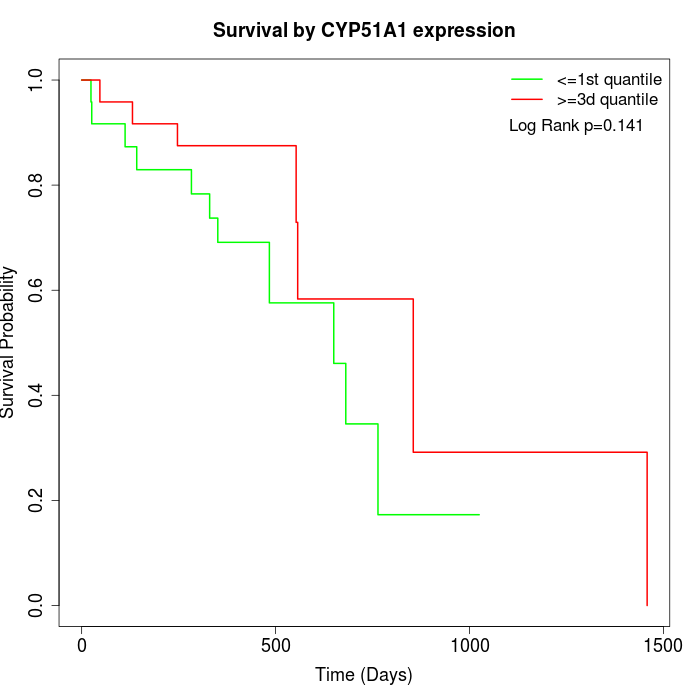 |
| GSE53622 | GSE53624 | TCGA |
Note: Click image to view full size file.
Copy number change of CYP51A1:
| Dataset | Gene | EntrezID | Gain | Loss | Normal | Detail |
|---|---|---|---|---|---|---|
| GSE15526 | CYP51A1 | 1595 | 13 | 0 | 17 | |
| GSE20123 | CYP51A1 | 1595 | 13 | 0 | 17 | |
| GSE43470 | CYP51A1 | 1595 | 6 | 1 | 36 | |
| GSE46452 | CYP51A1 | 1595 | 11 | 0 | 48 | |
| GSE47630 | CYP51A1 | 1595 | 9 | 2 | 29 | |
| GSE54993 | CYP51A1 | 1595 | 1 | 8 | 61 | |
| GSE54994 | CYP51A1 | 1595 | 16 | 2 | 35 | |
| GSE60625 | CYP51A1 | 1595 | 0 | 0 | 11 | |
| GSE74703 | CYP51A1 | 1595 | 5 | 1 | 30 | |
| GSE74704 | CYP51A1 | 1595 | 9 | 0 | 11 | |
| TCGA | CYP51A1 | 1595 | 56 | 4 | 36 |
Total number of gains: 139; Total number of losses: 18; Total Number of normals: 331.
Somatic mutations of CYP51A1:
Generating mutation plots.
Highly correlated genes for CYP51A1:
Showing all 1 correlated genes with mean PCC>0.5.
| Gene1 | Gene2 | Mean PCC | Num. Datasets | Num. PCC<0 | Num. PCC>0.5 |
|---|---|---|---|---|---|
| CYP51A1 | SLC25A13 | 0.709907 | 3 | 0 | 3 |
For details and further investigation, click here