| Full name: aprataxin and PNKP like factor | Alias Symbol: MGC47799|Xip1|ZCCHH1 | ||
| Type: protein-coding gene | Cytoband: 2p13.3 | ||
| Entrez ID: 200558 | HGNC ID: HGNC:28724 | Ensembl Gene: ENSG00000169621 | OMIM ID: 611035 |
Expression of APLF:
| Dataset | Gene | EntrezID | Probe | Log2FC | Adj.pValue | Expression |
|---|---|---|---|---|---|---|
| GSE17351 | APLF | 200558 | 1555100_at | -0.0937 | 0.7449 | |
| GSE26886 | APLF | 200558 | 1555100_at | -0.1047 | 0.2531 | |
| GSE45670 | APLF | 200558 | 1555100_at | 0.0776 | 0.4410 | |
| GSE53622 | APLF | 200558 | 89129 | -0.9250 | 0.0000 | |
| GSE53624 | APLF | 200558 | 89129 | -0.8754 | 0.0000 | |
| GSE63941 | APLF | 200558 | 1555100_at | -0.2651 | 0.1311 | |
| GSE77861 | APLF | 200558 | 1555100_at | -0.0486 | 0.7468 | |
| SRP007169 | APLF | 200558 | RNAseq | -2.6897 | 0.0000 | |
| SRP008496 | APLF | 200558 | RNAseq | -1.3975 | 0.0008 | |
| SRP064894 | APLF | 200558 | RNAseq | -0.4330 | 0.0164 | |
| SRP133303 | APLF | 200558 | RNAseq | -0.3966 | 0.0305 | |
| SRP159526 | APLF | 200558 | RNAseq | -0.3907 | 0.2773 | |
| SRP193095 | APLF | 200558 | RNAseq | -0.9079 | 0.0000 | |
| SRP219564 | APLF | 200558 | RNAseq | -0.3704 | 0.2523 | |
| TCGA | APLF | 200558 | RNAseq | 0.4079 | 0.0002 |
Upregulated datasets: 0; Downregulated datasets: 2.
Survival by APLF expression:
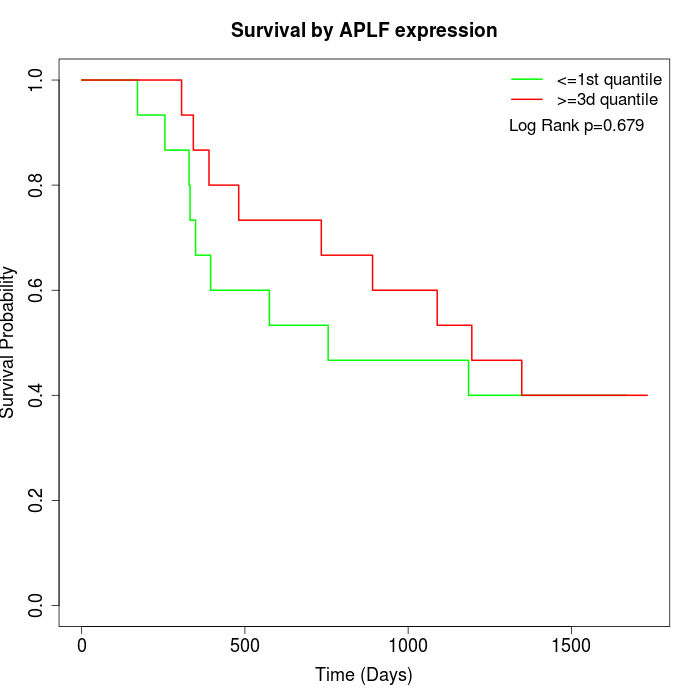 |  |  |
| GSE53622 | GSE53624 | TCGA |
Note: Click image to view full size file.
Copy number change of APLF:
| Dataset | Gene | EntrezID | Gain | Loss | Normal | Detail |
|---|---|---|---|---|---|---|
| GSE15526 | APLF | 200558 | 11 | 0 | 19 | |
| GSE20123 | APLF | 200558 | 11 | 0 | 19 | |
| GSE43470 | APLF | 200558 | 6 | 0 | 37 | |
| GSE46452 | APLF | 200558 | 2 | 3 | 54 | |
| GSE47630 | APLF | 200558 | 7 | 0 | 33 | |
| GSE54993 | APLF | 200558 | 0 | 6 | 64 | |
| GSE54994 | APLF | 200558 | 12 | 0 | 41 | |
| GSE60625 | APLF | 200558 | 0 | 3 | 8 | |
| GSE74703 | APLF | 200558 | 6 | 0 | 30 | |
| GSE74704 | APLF | 200558 | 9 | 0 | 11 | |
| TCGA | APLF | 200558 | 36 | 2 | 58 |
Total number of gains: 100; Total number of losses: 14; Total Number of normals: 374.
Somatic mutations of APLF:
Generating mutation plots.
Highly correlated genes for APLF:
Showing all 5 correlated genes with mean PCC>0.5.
| Gene1 | Gene2 | Mean PCC | Num. Datasets | Num. PCC<0 | Num. PCC>0.5 |
|---|---|---|---|---|---|
| APLF | PRKG1-AS1 | 0.572424 | 3 | 0 | 3 |
| APLF | FGF22 | 0.56936 | 3 | 0 | 3 |
| APLF | ZNF654 | 0.526818 | 3 | 0 | 3 |
| APLF | MTMR3 | 0.515428 | 5 | 0 | 3 |
| APLF | SCOC | 0.506945 | 4 | 0 | 3 |
For details and further investigation, click here