| Full name: kinase non-catalytic C-lobe domain containing 1 | Alias Symbol: KIAA1768|bB439H18.3|FLJ25027|Very-KIND|v-KIND | ||
| Type: protein-coding gene | Cytoband: 10q26.3 | ||
| Entrez ID: 85442 | HGNC ID: HGNC:29374 | Ensembl Gene: ENSG00000171798 | OMIM ID: 616237 |
Expression of KNDC1:
| Dataset | Gene | EntrezID | Probe | Log2FC | Adj.pValue | Expression |
|---|---|---|---|---|---|---|
| GSE17351 | KNDC1 | 85442 | 230359_at | -0.1319 | 0.4791 | |
| GSE26886 | KNDC1 | 85442 | 230359_at | 0.1823 | 0.1315 | |
| GSE45670 | KNDC1 | 85442 | 230558_at | 0.2314 | 0.0048 | |
| GSE53622 | KNDC1 | 85442 | 14646 | -0.5430 | 0.0006 | |
| GSE53624 | KNDC1 | 85442 | 14646 | -0.1380 | 0.1099 | |
| GSE63941 | KNDC1 | 85442 | 230359_at | 0.0197 | 0.9734 | |
| GSE77861 | KNDC1 | 85442 | 230558_at | -0.0084 | 0.9655 | |
| SRP064894 | KNDC1 | 85442 | RNAseq | 0.2533 | 0.4581 | |
| SRP133303 | KNDC1 | 85442 | RNAseq | 0.1764 | 0.4645 | |
| SRP159526 | KNDC1 | 85442 | RNAseq | 0.8979 | 0.2408 | |
| SRP193095 | KNDC1 | 85442 | RNAseq | -0.0522 | 0.7631 | |
| SRP219564 | KNDC1 | 85442 | RNAseq | -0.3260 | 0.5095 | |
| TCGA | KNDC1 | 85442 | RNAseq | -0.2562 | 0.6142 |
Upregulated datasets: 0; Downregulated datasets: 0.
Survival by KNDC1 expression:
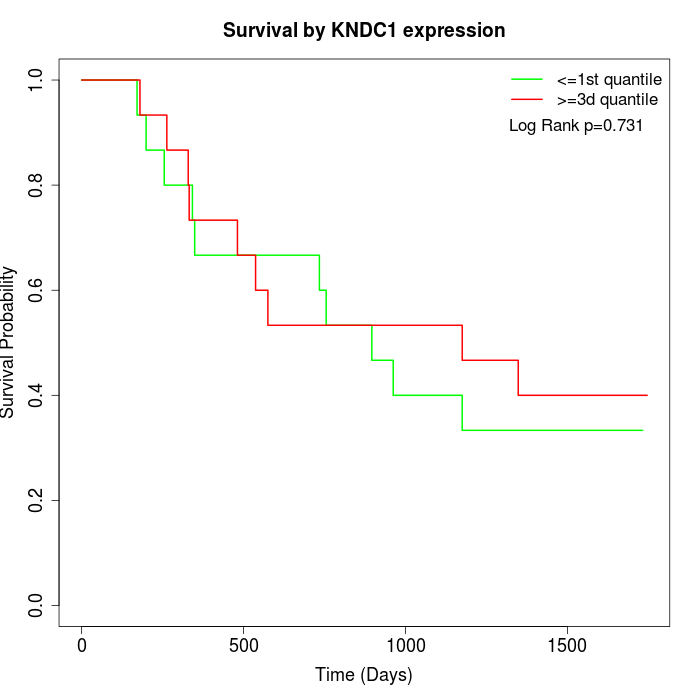 | 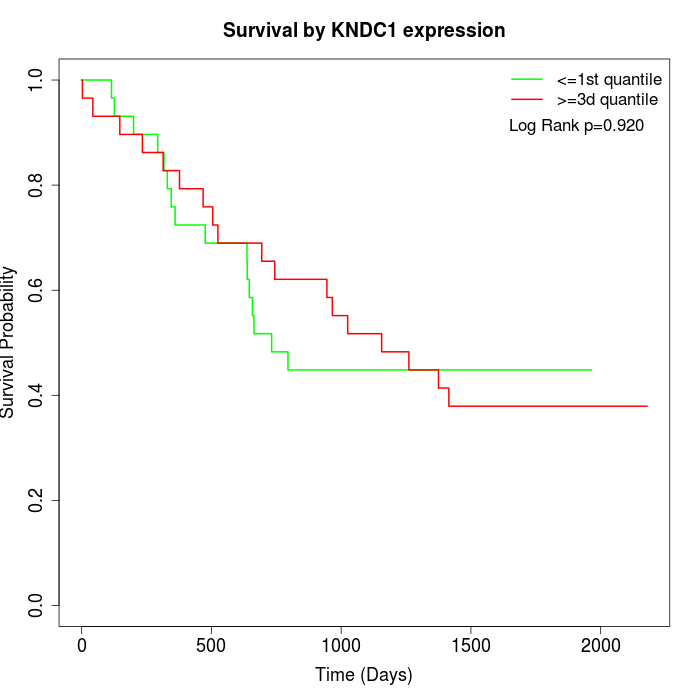 | 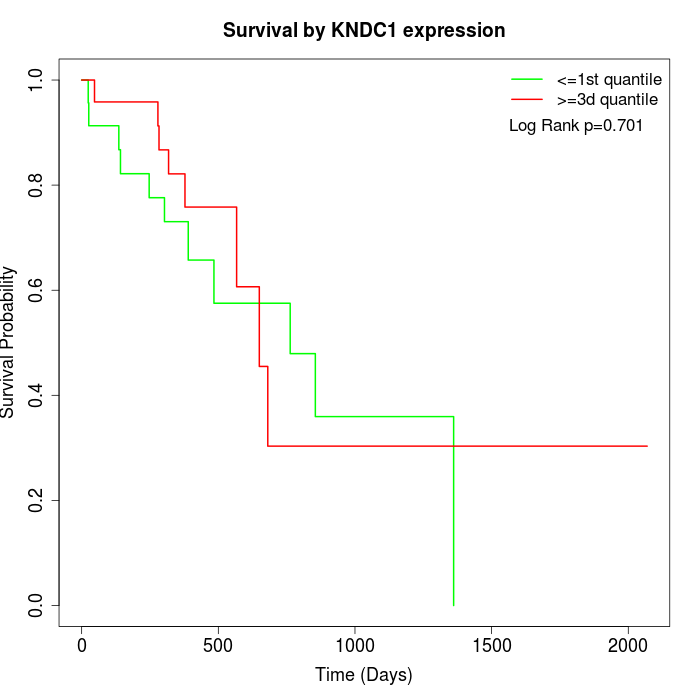 |
| GSE53622 | GSE53624 | TCGA |
Note: Click image to view full size file.
Copy number change of KNDC1:
| Dataset | Gene | EntrezID | Gain | Loss | Normal | Detail |
|---|---|---|---|---|---|---|
| GSE15526 | KNDC1 | 85442 | 3 | 8 | 19 | |
| GSE20123 | KNDC1 | 85442 | 3 | 9 | 18 | |
| GSE43470 | KNDC1 | 85442 | 0 | 9 | 34 | |
| GSE46452 | KNDC1 | 85442 | 1 | 11 | 47 | |
| GSE47630 | KNDC1 | 85442 | 4 | 13 | 23 | |
| GSE54993 | KNDC1 | 85442 | 8 | 2 | 60 | |
| GSE54994 | KNDC1 | 85442 | 1 | 9 | 43 | |
| GSE60625 | KNDC1 | 85442 | 0 | 0 | 11 | |
| GSE74703 | KNDC1 | 85442 | 0 | 6 | 30 | |
| GSE74704 | KNDC1 | 85442 | 3 | 4 | 13 | |
| TCGA | KNDC1 | 85442 | 7 | 28 | 61 |
Total number of gains: 30; Total number of losses: 99; Total Number of normals: 359.
Somatic mutations of KNDC1:
Generating mutation plots.
Highly correlated genes for KNDC1:
Showing all 6 correlated genes with mean PCC>0.5.
| Gene1 | Gene2 | Mean PCC | Num. Datasets | Num. PCC<0 | Num. PCC>0.5 |
|---|---|---|---|---|---|
| KNDC1 | NOL3 | 0.611058 | 3 | 0 | 3 |
| KNDC1 | FRMD1 | 0.583269 | 3 | 0 | 3 |
| KNDC1 | ARIH2OS | 0.580608 | 4 | 0 | 3 |
| KNDC1 | NRP2 | 0.543622 | 3 | 0 | 3 |
| KNDC1 | LINC00334 | 0.530051 | 4 | 0 | 3 |
| KNDC1 | MYL4 | 0.503159 | 5 | 0 | 3 |
For details and further investigation, click here