| Full name: trans-golgi network vesicle protein 23 homolog A | Alias Symbol: YDR084C | ||
| Type: protein-coding gene | Cytoband: 16p13.13 | ||
| Entrez ID: 780776 | HGNC ID: HGNC:20398 | Ensembl Gene: ENSG00000166676 | OMIM ID: |
Expression of TVP23A:
| Dataset | Gene | EntrezID | Probe | Log2FC | Adj.pValue | Expression |
|---|---|---|---|---|---|---|
| GSE17351 | TVP23A | 780776 | 1563638_at | -0.0655 | 0.8003 | |
| GSE26886 | TVP23A | 780776 | 1563638_at | 0.0400 | 0.6759 | |
| GSE45670 | TVP23A | 780776 | 1563638_at | -0.0955 | 0.0731 | |
| GSE53622 | TVP23A | 780776 | 55161 | 0.0659 | 0.7448 | |
| GSE53624 | TVP23A | 780776 | 55161 | 0.0972 | 0.2812 | |
| GSE63941 | TVP23A | 780776 | 1563638_at | -0.0469 | 0.7447 | |
| GSE77861 | TVP23A | 780776 | 1563638_at | -0.0095 | 0.9247 | |
| SRP064894 | TVP23A | 780776 | RNAseq | -0.4171 | 0.0142 | |
| SRP133303 | TVP23A | 780776 | RNAseq | -0.1028 | 0.4193 | |
| SRP159526 | TVP23A | 780776 | RNAseq | -0.9126 | 0.0011 | |
| SRP193095 | TVP23A | 780776 | RNAseq | -0.0399 | 0.7738 | |
| SRP219564 | TVP23A | 780776 | RNAseq | 0.1393 | 0.7414 |
Upregulated datasets: 0; Downregulated datasets: 0.
Survival by TVP23A expression:
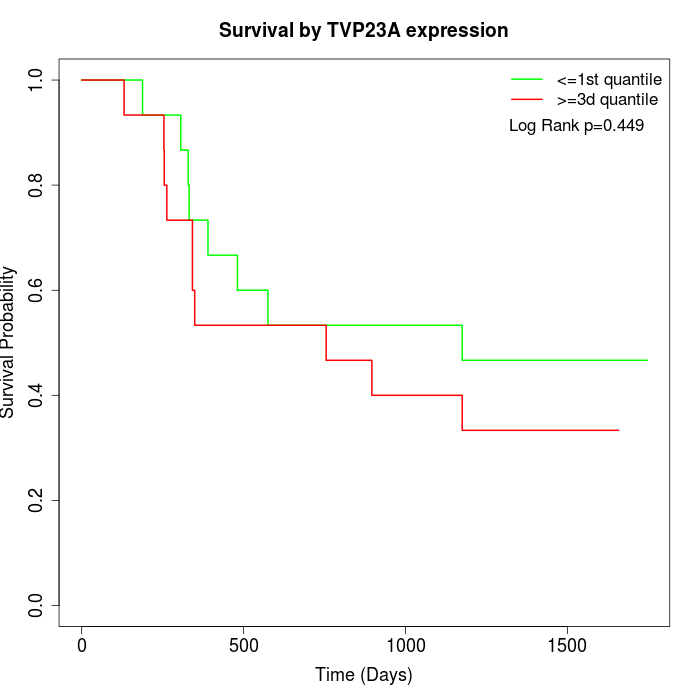 | 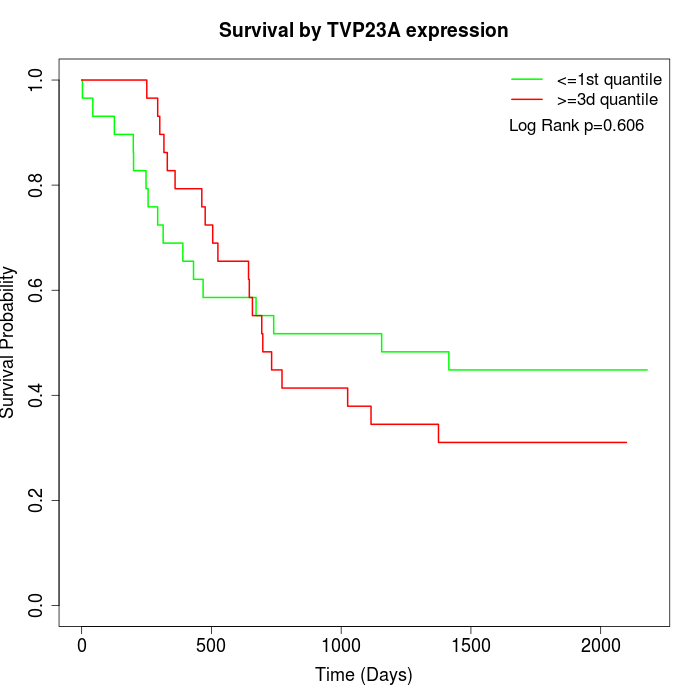 |
| GSE53622 | GSE53624 |
Note: Click image to view full size file.
Copy number change of TVP23A:
| Dataset | Gene | EntrezID | Gain | Loss | Normal | Detail |
|---|---|---|---|---|---|---|
| GSE15526 | TVP23A | 780776 | 5 | 4 | 21 | |
| GSE20123 | TVP23A | 780776 | 5 | 3 | 22 | |
| GSE43470 | TVP23A | 780776 | 3 | 3 | 37 | |
| GSE46452 | TVP23A | 780776 | 38 | 1 | 20 | |
| GSE47630 | TVP23A | 780776 | 14 | 6 | 20 | |
| GSE54993 | TVP23A | 780776 | 3 | 5 | 62 | |
| GSE54994 | TVP23A | 780776 | 5 | 9 | 39 | |
| GSE60625 | TVP23A | 780776 | 4 | 0 | 7 | |
| GSE74703 | TVP23A | 780776 | 3 | 2 | 31 | |
| GSE74704 | TVP23A | 780776 | 2 | 1 | 17 | |
| TCGA | TVP23A | 780776 | 19 | 13 | 64 |
Total number of gains: 101; Total number of losses: 47; Total Number of normals: 340.
Somatic mutations of TVP23A:
Generating mutation plots.
Highly correlated genes for TVP23A:
Showing all 5 correlated genes with mean PCC>0.5.
| Gene1 | Gene2 | Mean PCC | Num. Datasets | Num. PCC<0 | Num. PCC>0.5 |
|---|---|---|---|---|---|
| TVP23A | CLTCL1 | 0.645957 | 3 | 0 | 3 |
| TVP23A | SPP2 | 0.625198 | 3 | 0 | 3 |
| TVP23A | LINC01007 | 0.604548 | 3 | 0 | 3 |
| TVP23A | SNORA71B | 0.54046 | 3 | 0 | 3 |
| TVP23A | COL26A1 | 0.527026 | 4 | 0 | 3 |
For details and further investigation, click here