| Full name: ubiquitin protein ligase E3D | Alias Symbol: DKFZp434A1520|H10BH|YJR141W | ||
| Type: protein-coding gene | Cytoband: 6q14.1 | ||
| Entrez ID: 90025 | HGNC ID: HGNC:21381 | Ensembl Gene: ENSG00000118420 | OMIM ID: 612495 |
Screen Evidence:
| |||
Expression of UBE3D:
| Dataset | Gene | EntrezID | Probe | Log2FC | Adj.pValue | Expression |
|---|---|---|---|---|---|---|
| GSE17351 | UBE3D | 90025 | 227790_at | -0.1745 | 0.6919 | |
| GSE26886 | UBE3D | 90025 | 227790_at | 0.1022 | 0.6249 | |
| GSE45670 | UBE3D | 90025 | 227790_at | 0.2362 | 0.1683 | |
| GSE53622 | UBE3D | 90025 | 60290 | 0.2606 | 0.0005 | |
| GSE53624 | UBE3D | 90025 | 111715 | 0.1114 | 0.1338 | |
| GSE63941 | UBE3D | 90025 | 227790_at | -0.5187 | 0.2302 | |
| GSE77861 | UBE3D | 90025 | 227790_at | -0.0403 | 0.8471 | |
| SRP007169 | UBE3D | 90025 | RNAseq | -0.2834 | 0.5940 | |
| SRP008496 | UBE3D | 90025 | RNAseq | -0.0502 | 0.8903 | |
| SRP064894 | UBE3D | 90025 | RNAseq | 0.0919 | 0.5993 | |
| SRP133303 | UBE3D | 90025 | RNAseq | 0.2907 | 0.0278 | |
| SRP159526 | UBE3D | 90025 | RNAseq | 0.0007 | 0.9983 | |
| SRP193095 | UBE3D | 90025 | RNAseq | 0.0566 | 0.6841 | |
| SRP219564 | UBE3D | 90025 | RNAseq | 0.0486 | 0.9186 |
Upregulated datasets: 0; Downregulated datasets: 0.
Survival by UBE3D expression:
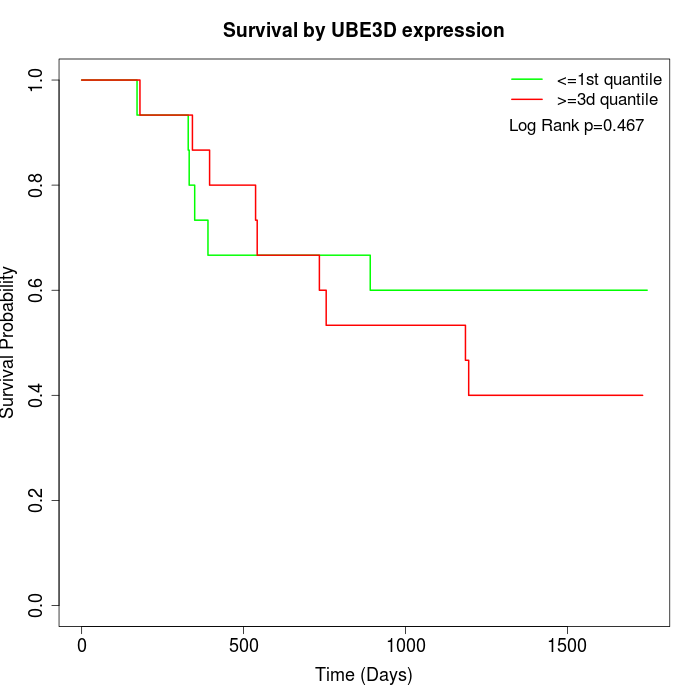 | 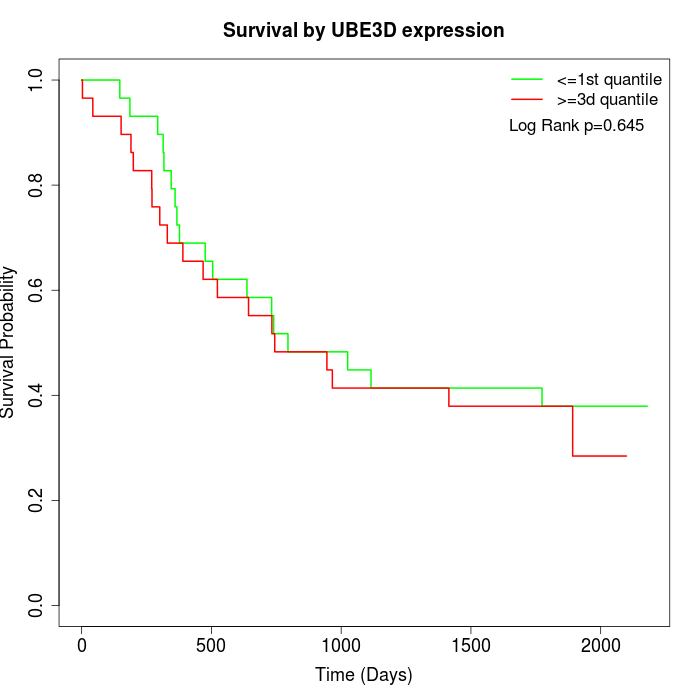 |
| GSE53622 | GSE53624 |
Note: Click image to view full size file.
Copy number change of UBE3D:
| Dataset | Gene | EntrezID | Gain | Loss | Normal | Detail |
|---|---|---|---|---|---|---|
| GSE15526 | UBE3D | 90025 | 1 | 4 | 25 | |
| GSE20123 | UBE3D | 90025 | 1 | 3 | 26 | |
| GSE43470 | UBE3D | 90025 | 2 | 1 | 40 | |
| GSE46452 | UBE3D | 90025 | 2 | 11 | 46 | |
| GSE47630 | UBE3D | 90025 | 8 | 6 | 26 | |
| GSE54993 | UBE3D | 90025 | 3 | 2 | 65 | |
| GSE54994 | UBE3D | 90025 | 8 | 8 | 37 | |
| GSE60625 | UBE3D | 90025 | 0 | 1 | 10 | |
| GSE74703 | UBE3D | 90025 | 2 | 1 | 33 | |
| GSE74704 | UBE3D | 90025 | 0 | 2 | 18 | |
| TCGA | UBE3D | 90025 | 6 | 25 | 65 |
Total number of gains: 33; Total number of losses: 64; Total Number of normals: 391.
Somatic mutations of UBE3D:
Generating mutation plots.
Highly correlated genes for UBE3D:
Showing all 6 correlated genes with mean PCC>0.5.
| Gene1 | Gene2 | Mean PCC | Num. Datasets | Num. PCC<0 | Num. PCC>0.5 |
|---|---|---|---|---|---|
| UBE3D | DDX11-AS1 | 0.625416 | 3 | 0 | 3 |
| UBE3D | LINC00960 | 0.564884 | 3 | 0 | 3 |
| UBE3D | DIAPH2-AS1 | 0.5636 | 3 | 0 | 3 |
| UBE3D | OBSL1 | 0.561686 | 3 | 0 | 3 |
| UBE3D | LINC00622 | 0.536764 | 3 | 0 | 3 |
| UBE3D | THAP6 | 0.517171 | 4 | 0 | 3 |
For details and further investigation, click here