| Full name: zinc finger and BTB domain containing 49 | Alias Symbol: FLJ38559 | ||
| Type: protein-coding gene | Cytoband: 4p16.3 | ||
| Entrez ID: 166793 | HGNC ID: HGNC:19883 | Ensembl Gene: ENSG00000168826 | OMIM ID: 616238 |
Expression of ZBTB49:
| Dataset | Gene | EntrezID | Probe | Log2FC | Adj.pValue | Expression |
|---|---|---|---|---|---|---|
| GSE17351 | ZBTB49 | 166793 | 229089_at | 0.1368 | 0.8058 | |
| GSE26886 | ZBTB49 | 166793 | 229089_at | 0.0750 | 0.6762 | |
| GSE45670 | ZBTB49 | 166793 | 229089_at | -0.0172 | 0.9082 | |
| GSE53622 | ZBTB49 | 166793 | 74949 | -0.3107 | 0.0027 | |
| GSE53624 | ZBTB49 | 166793 | 74949 | -0.2238 | 0.0052 | |
| GSE63941 | ZBTB49 | 166793 | 229089_at | -0.2501 | 0.2411 | |
| GSE77861 | ZBTB49 | 166793 | 229089_at | -0.0599 | 0.4224 | |
| SRP007169 | ZBTB49 | 166793 | RNAseq | -0.4861 | 0.4987 | |
| SRP064894 | ZBTB49 | 166793 | RNAseq | 0.0500 | 0.7611 | |
| SRP133303 | ZBTB49 | 166793 | RNAseq | -0.1531 | 0.3482 | |
| SRP159526 | ZBTB49 | 166793 | RNAseq | -0.0398 | 0.9181 | |
| SRP193095 | ZBTB49 | 166793 | RNAseq | -0.0908 | 0.4323 | |
| SRP219564 | ZBTB49 | 166793 | RNAseq | -0.0639 | 0.8696 | |
| TCGA | ZBTB49 | 166793 | RNAseq | -0.1407 | 0.0722 |
Upregulated datasets: 0; Downregulated datasets: 0.
Survival by ZBTB49 expression:
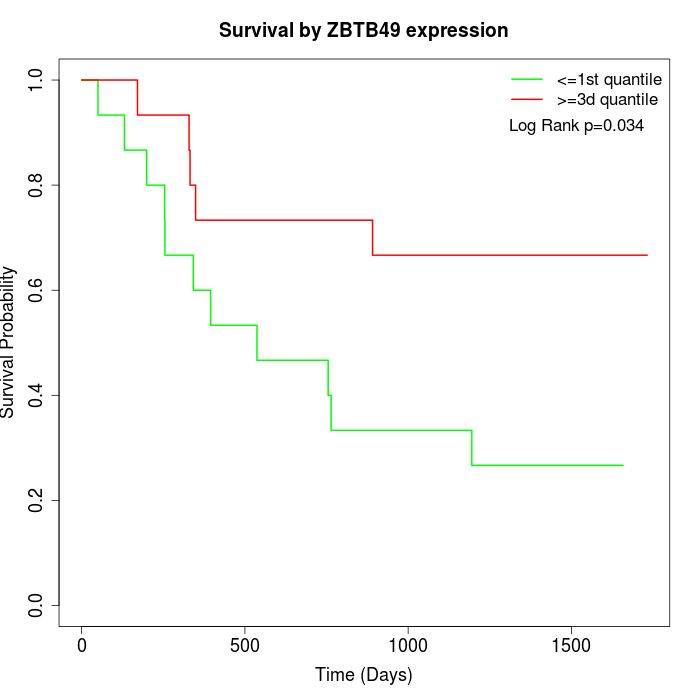 | 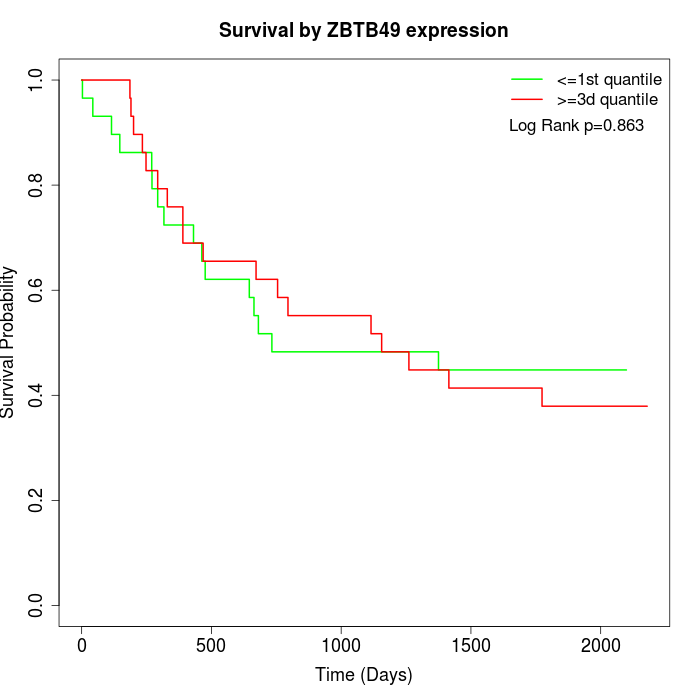 | 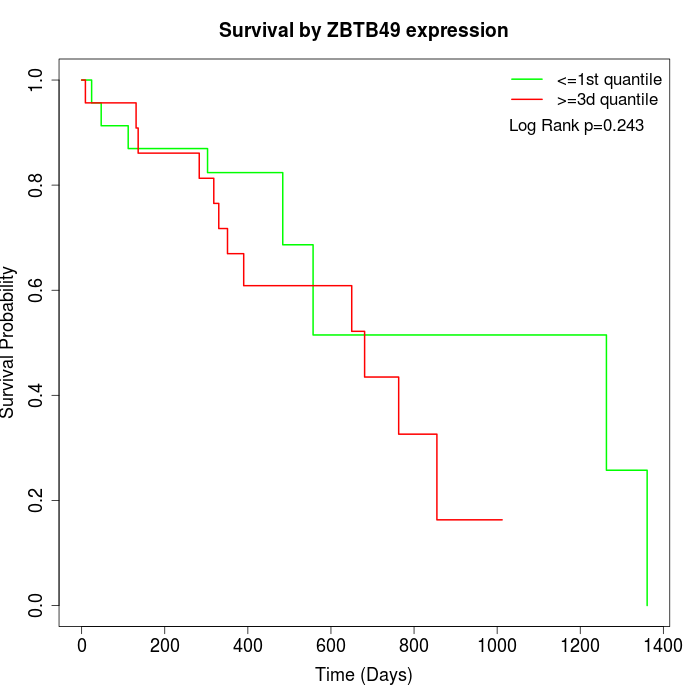 |
| GSE53622 | GSE53624 | TCGA |
Note: Click image to view full size file.
Copy number change of ZBTB49:
| Dataset | Gene | EntrezID | Gain | Loss | Normal | Detail |
|---|---|---|---|---|---|---|
| GSE15526 | ZBTB49 | 166793 | 0 | 17 | 13 | |
| GSE20123 | ZBTB49 | 166793 | 0 | 17 | 13 | |
| GSE43470 | ZBTB49 | 166793 | 0 | 17 | 26 | |
| GSE46452 | ZBTB49 | 166793 | 1 | 36 | 22 | |
| GSE47630 | ZBTB49 | 166793 | 1 | 19 | 20 | |
| GSE54993 | ZBTB49 | 166793 | 10 | 0 | 60 | |
| GSE54994 | ZBTB49 | 166793 | 3 | 12 | 38 | |
| GSE60625 | ZBTB49 | 166793 | 0 | 0 | 11 | |
| GSE74703 | ZBTB49 | 166793 | 0 | 13 | 23 | |
| GSE74704 | ZBTB49 | 166793 | 0 | 9 | 11 | |
| TCGA | ZBTB49 | 166793 | 7 | 47 | 42 |
Total number of gains: 22; Total number of losses: 187; Total Number of normals: 279.
Somatic mutations of ZBTB49:
Generating mutation plots.
Highly correlated genes for ZBTB49:
Showing all 7 correlated genes with mean PCC>0.5.
| Gene1 | Gene2 | Mean PCC | Num. Datasets | Num. PCC<0 | Num. PCC>0.5 |
|---|---|---|---|---|---|
| ZBTB49 | RNF4 | 0.613783 | 3 | 0 | 3 |
| ZBTB49 | MRFAP1L1 | 0.593436 | 4 | 0 | 3 |
| ZBTB49 | OPA3 | 0.582936 | 3 | 0 | 3 |
| ZBTB49 | ZBTB42 | 0.579854 | 3 | 0 | 3 |
| ZBTB49 | FAM193A | 0.566474 | 6 | 0 | 3 |
| ZBTB49 | QDPR | 0.558945 | 4 | 0 | 3 |
| ZBTB49 | TADA2B | 0.532855 | 7 | 0 | 4 |
For details and further investigation, click here