| Full name: integrin subunit beta 6 | Alias Symbol: | ||
| Type: protein-coding gene | Cytoband: 2q24.2 | ||
| Entrez ID: 3694 | HGNC ID: HGNC:6161 | Ensembl Gene: ENSG00000115221 | OMIM ID: 147558 |
| Related drugs: DI17E6, INTETUMUMAB, STX-100... [more] | |||
ITGB6 involved pathways:
| KEGG pathway | Description | View |
|---|---|---|
| hsa04151 | PI3K-Akt signaling pathway | |
| hsa04510 | Focal adhesion | |
| hsa04810 | Regulation of actin cytoskeleton |
Expression of ITGB6:
| Dataset | Gene | EntrezID | Probe | Log2FC | Adj.pValue | Expression |
|---|---|---|---|---|---|---|
| GSE53622 | ITGB6 | 3694 | 106301 | 1.2764 | 0.0000 | |
| GSE53624 | ITGB6 | 3694 | 25444 | 0.6746 | 0.0000 | |
| GSE97050 | ITGB6 | 3694 | A_23_P154217 | 2.8650 | 0.1711 | |
| SRP007169 | ITGB6 | 3694 | RNAseq | 0.9970 | 0.0061 | |
| SRP008496 | ITGB6 | 3694 | RNAseq | 1.0586 | 0.0012 | |
| SRP064894 | ITGB6 | 3694 | RNAseq | 1.3672 | 0.0035 | |
| SRP133303 | ITGB6 | 3694 | RNAseq | 2.1174 | 0.0000 | |
| SRP159526 | ITGB6 | 3694 | RNAseq | -0.7421 | 0.1090 | |
| SRP193095 | ITGB6 | 3694 | RNAseq | 0.6347 | 0.0213 | |
| SRP219564 | ITGB6 | 3694 | RNAseq | 0.9077 | 0.5175 | |
| TCGA | ITGB6 | 3694 | RNAseq | 0.4333 | 0.0434 |
Upregulated datasets: 4; Downregulated datasets: 0.
Survival by ITGB6 expression:
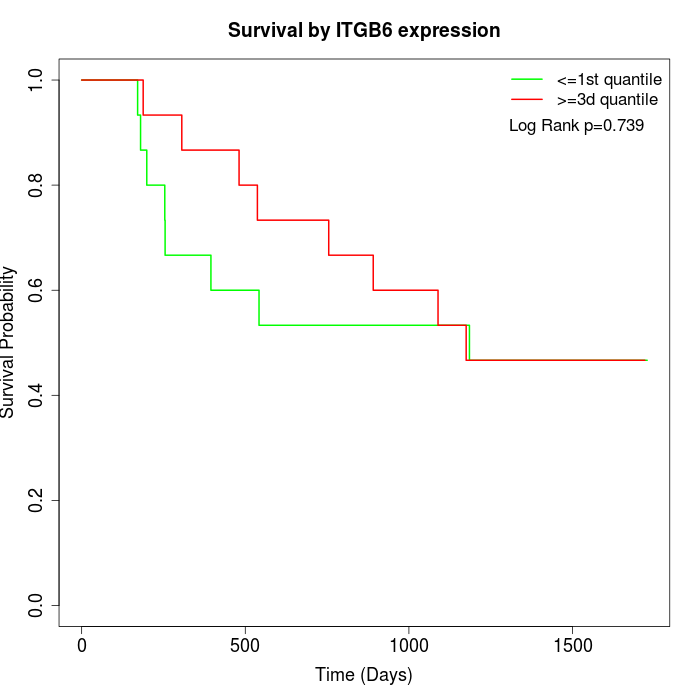 | 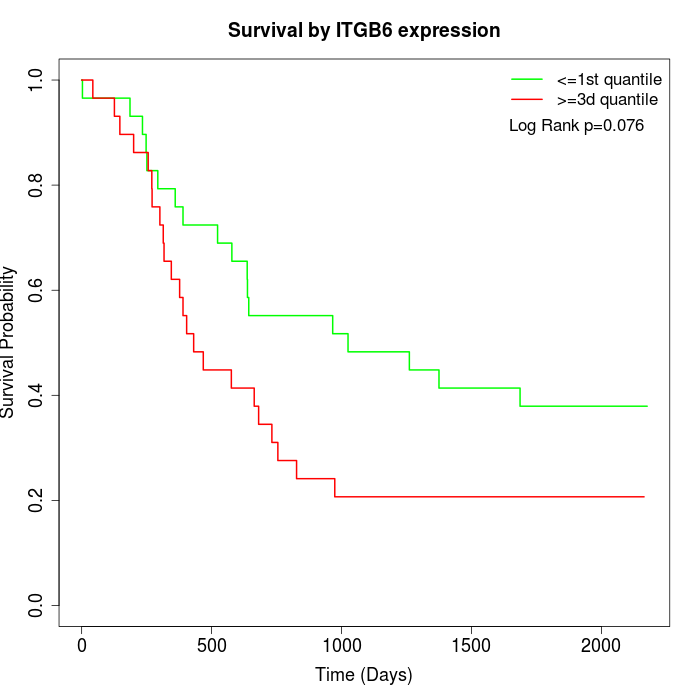 | 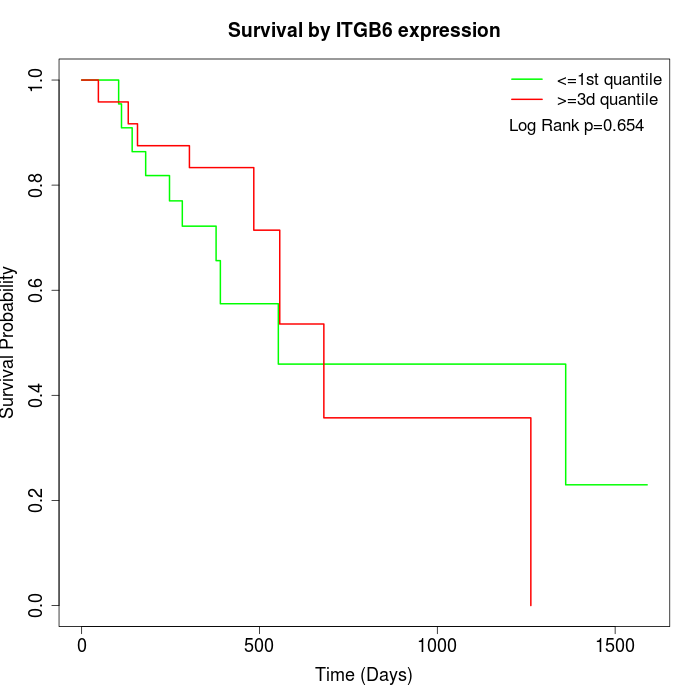 |
| GSE53622 | GSE53624 | TCGA |
Note: Click image to view full size file.
Copy number change of ITGB6:
| Dataset | Gene | EntrezID | Gain | Loss | Normal | Detail |
|---|---|---|---|---|---|---|
| GSE15526 | ITGB6 | 3694 | 5 | 1 | 24 | |
| GSE20123 | ITGB6 | 3694 | 5 | 1 | 24 | |
| GSE43470 | ITGB6 | 3694 | 4 | 1 | 38 | |
| GSE46452 | ITGB6 | 3694 | 1 | 4 | 54 | |
| GSE47630 | ITGB6 | 3694 | 5 | 3 | 32 | |
| GSE54993 | ITGB6 | 3694 | 0 | 4 | 66 | |
| GSE54994 | ITGB6 | 3694 | 11 | 2 | 40 | |
| GSE60625 | ITGB6 | 3694 | 0 | 3 | 8 | |
| GSE74703 | ITGB6 | 3694 | 3 | 1 | 32 | |
| GSE74704 | ITGB6 | 3694 | 3 | 0 | 17 | |
| TCGA | ITGB6 | 3694 | 23 | 10 | 63 |
Total number of gains: 60; Total number of losses: 30; Total Number of normals: 398.
Somatic mutations of ITGB6:
Generating mutation plots.
Highly correlated genes for ITGB6:
Showing all 5 correlated genes with mean PCC>0.5.
| Gene1 | Gene2 | Mean PCC | Num. Datasets | Num. PCC<0 | Num. PCC>0.5 |
|---|---|---|---|---|---|
| ITGB6 | TNS4 | 0.685387 | 3 | 0 | 3 |
| ITGB6 | LAMB3 | 0.681258 | 3 | 0 | 3 |
| ITGB6 | COL17A1 | 0.594169 | 3 | 0 | 3 |
| ITGB6 | IL1RAP | 0.591687 | 4 | 0 | 3 |
| ITGB6 | PLEK2 | 0.573971 | 4 | 0 | 3 |
For details and further investigation, click here