| Full name: pleckstrin 2 | Alias Symbol: | ||
| Type: protein-coding gene | Cytoband: 14q23.3-q24.1 | ||
| Entrez ID: 26499 | HGNC ID: HGNC:19238 | Ensembl Gene: ENSG00000100558 | OMIM ID: 608007 |
Expression of PLEK2:
| Dataset | Gene | EntrezID | Probe | Log2FC | Adj.pValue | Expression |
|---|---|---|---|---|---|---|
| GSE17351 | PLEK2 | 26499 | 218644_at | 0.8022 | 0.3768 | |
| GSE20347 | PLEK2 | 26499 | 218644_at | 0.7076 | 0.0011 | |
| GSE23400 | PLEK2 | 26499 | 218644_at | 0.7158 | 0.0000 | |
| GSE26886 | PLEK2 | 26499 | 218644_at | 0.8689 | 0.0116 | |
| GSE29001 | PLEK2 | 26499 | 218644_at | 0.8463 | 0.0137 | |
| GSE38129 | PLEK2 | 26499 | 218644_at | 1.0392 | 0.0002 | |
| GSE45670 | PLEK2 | 26499 | 218644_at | 1.2192 | 0.0058 | |
| GSE53622 | PLEK2 | 26499 | 162754 | 1.3675 | 0.0000 | |
| GSE53624 | PLEK2 | 26499 | 162754 | 1.4083 | 0.0000 | |
| GSE63941 | PLEK2 | 26499 | 218644_at | 2.7670 | 0.0001 | |
| GSE77861 | PLEK2 | 26499 | 218644_at | 0.2855 | 0.6395 | |
| GSE97050 | PLEK2 | 26499 | A_23_P151506 | 1.8704 | 0.0832 | |
| SRP007169 | PLEK2 | 26499 | RNAseq | 1.6068 | 0.0006 | |
| SRP008496 | PLEK2 | 26499 | RNAseq | 1.2781 | 0.0007 | |
| SRP064894 | PLEK2 | 26499 | RNAseq | 1.9121 | 0.0000 | |
| SRP133303 | PLEK2 | 26499 | RNAseq | 1.6830 | 0.0000 | |
| SRP159526 | PLEK2 | 26499 | RNAseq | -0.0715 | 0.8795 | |
| SRP193095 | PLEK2 | 26499 | RNAseq | 0.4476 | 0.1055 | |
| SRP219564 | PLEK2 | 26499 | RNAseq | 1.8812 | 0.0621 | |
| TCGA | PLEK2 | 26499 | RNAseq | 0.6828 | 0.0006 |
Upregulated datasets: 9; Downregulated datasets: 0.
Survival by PLEK2 expression:
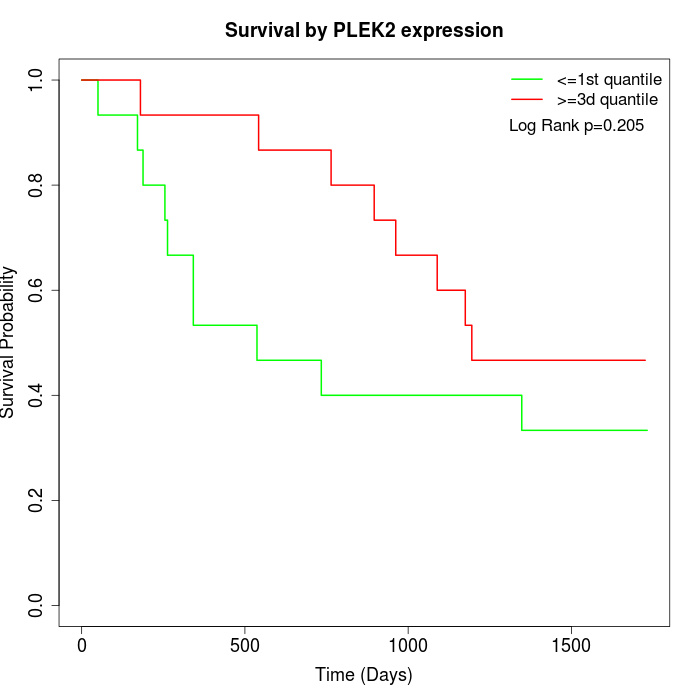 | 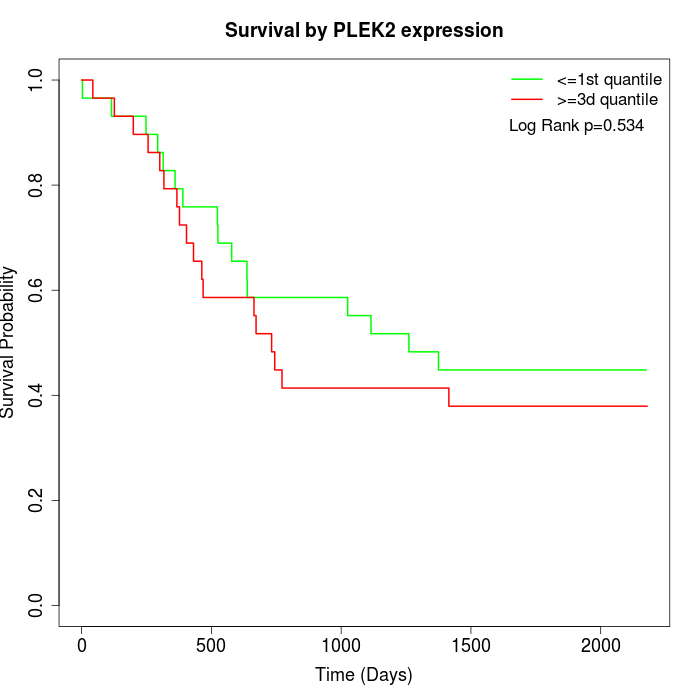 | 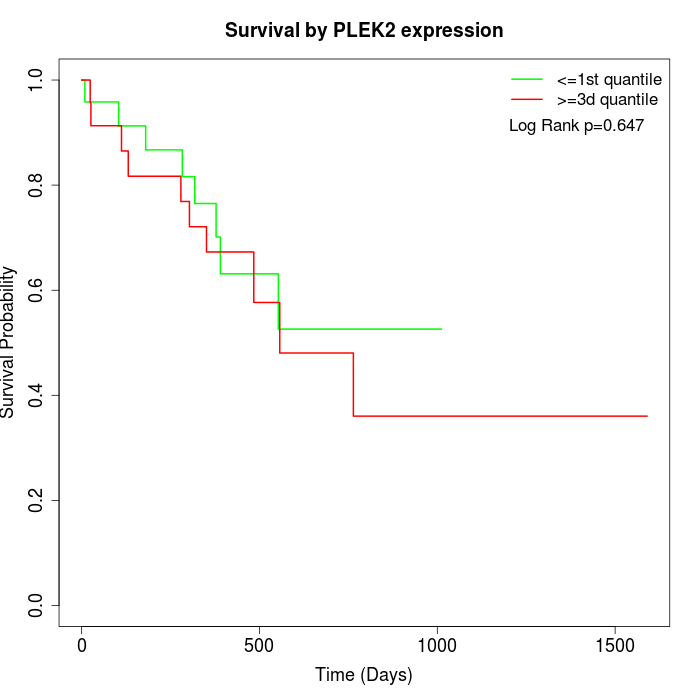 |
| GSE53622 | GSE53624 | TCGA |
Note: Click image to view full size file.
Copy number change of PLEK2:
| Dataset | Gene | EntrezID | Gain | Loss | Normal | Detail |
|---|---|---|---|---|---|---|
| GSE15526 | PLEK2 | 26499 | 7 | 3 | 20 | |
| GSE20123 | PLEK2 | 26499 | 7 | 3 | 20 | |
| GSE43470 | PLEK2 | 26499 | 8 | 2 | 33 | |
| GSE46452 | PLEK2 | 26499 | 16 | 3 | 40 | |
| GSE47630 | PLEK2 | 26499 | 11 | 9 | 20 | |
| GSE54993 | PLEK2 | 26499 | 3 | 9 | 58 | |
| GSE54994 | PLEK2 | 26499 | 18 | 5 | 30 | |
| GSE60625 | PLEK2 | 26499 | 0 | 2 | 9 | |
| GSE74703 | PLEK2 | 26499 | 7 | 2 | 27 | |
| GSE74704 | PLEK2 | 26499 | 3 | 2 | 15 | |
| TCGA | PLEK2 | 26499 | 34 | 14 | 48 |
Total number of gains: 114; Total number of losses: 54; Total Number of normals: 320.
Somatic mutations of PLEK2:
Generating mutation plots.
Highly correlated genes for PLEK2:
Showing top 20/1313 corelated genes with mean PCC>0.5.
| Gene1 | Gene2 | Mean PCC | Num. Datasets | Num. PCC<0 | Num. PCC>0.5 |
|---|---|---|---|---|---|
| PLEK2 | SCAMP1 | 0.767191 | 3 | 0 | 3 |
| PLEK2 | IKBIP | 0.746938 | 6 | 0 | 6 |
| PLEK2 | PLEKHH1 | 0.737947 | 3 | 0 | 3 |
| PLEK2 | GFM2 | 0.732413 | 3 | 0 | 3 |
| PLEK2 | EAF2 | 0.725661 | 3 | 0 | 3 |
| PLEK2 | MTHFD1L | 0.724541 | 3 | 0 | 3 |
| PLEK2 | EME1 | 0.718632 | 5 | 0 | 5 |
| PLEK2 | CDH3 | 0.716046 | 11 | 0 | 11 |
| PLEK2 | DCBLD1 | 0.711787 | 8 | 0 | 7 |
| PLEK2 | ITGA3 | 0.709235 | 13 | 0 | 12 |
| PLEK2 | FAM89A | 0.706865 | 3 | 0 | 3 |
| PLEK2 | CDKN3 | 0.70216 | 12 | 0 | 12 |
| PLEK2 | CYP27C1 | 0.700591 | 8 | 0 | 7 |
| PLEK2 | UTP15 | 0.700314 | 4 | 0 | 3 |
| PLEK2 | LAMC2 | 0.699175 | 13 | 0 | 13 |
| PLEK2 | STON2 | 0.698752 | 9 | 0 | 7 |
| PLEK2 | RCC2 | 0.69839 | 4 | 0 | 4 |
| PLEK2 | WDHD1 | 0.696831 | 12 | 0 | 10 |
| PLEK2 | AMIGO2 | 0.691543 | 10 | 0 | 10 |
| PLEK2 | STRIP2 | 0.691105 | 5 | 0 | 5 |
For details and further investigation, click here