| Full name: PTOV1 antisense RNA 1 | Alias Symbol: | ||
| Type: non-coding RNA | Cytoband: 19q13.33 | ||
| Entrez ID: 100506033 | HGNC ID: HGNC:44174 | Ensembl Gene: ENSG00000268006 | OMIM ID: |
Expression of PTOV1-AS1:
| Dataset | Gene | EntrezID | Probe | Log2FC | Adj.pValue | Expression |
|---|---|---|---|---|---|---|
| GSE17351 | PTOV1-AS1 | 100506033 | 233745_at | 0.0703 | 0.7852 | |
| GSE26886 | PTOV1-AS1 | 100506033 | 233745_at | -0.0429 | 0.7773 | |
| GSE45670 | PTOV1-AS1 | 100506033 | 240615_at | 0.1605 | 0.3628 | |
| GSE53622 | PTOV1-AS1 | 100506033 | 83455 | -0.0801 | 0.5157 | |
| GSE53624 | PTOV1-AS1 | 100506033 | 83455 | -0.1613 | 0.0137 | |
| GSE63941 | PTOV1-AS1 | 100506033 | 233745_at | 0.0204 | 0.8989 | |
| GSE77861 | PTOV1-AS1 | 100506033 | 233745_at | -0.1344 | 0.1231 | |
| SRP007169 | PTOV1-AS1 | 100506033 | RNAseq | 0.6310 | 0.3464 | |
| SRP064894 | PTOV1-AS1 | 100506033 | RNAseq | 0.2604 | 0.2475 | |
| SRP133303 | PTOV1-AS1 | 100506033 | RNAseq | 0.1487 | 0.4484 | |
| SRP159526 | PTOV1-AS1 | 100506033 | RNAseq | 0.3875 | 0.3579 | |
| SRP193095 | PTOV1-AS1 | 100506033 | RNAseq | -0.0208 | 0.8589 | |
| SRP219564 | PTOV1-AS1 | 100506033 | RNAseq | -0.2279 | 0.4095 |
Upregulated datasets: 0; Downregulated datasets: 0.
Survival by PTOV1-AS1 expression:
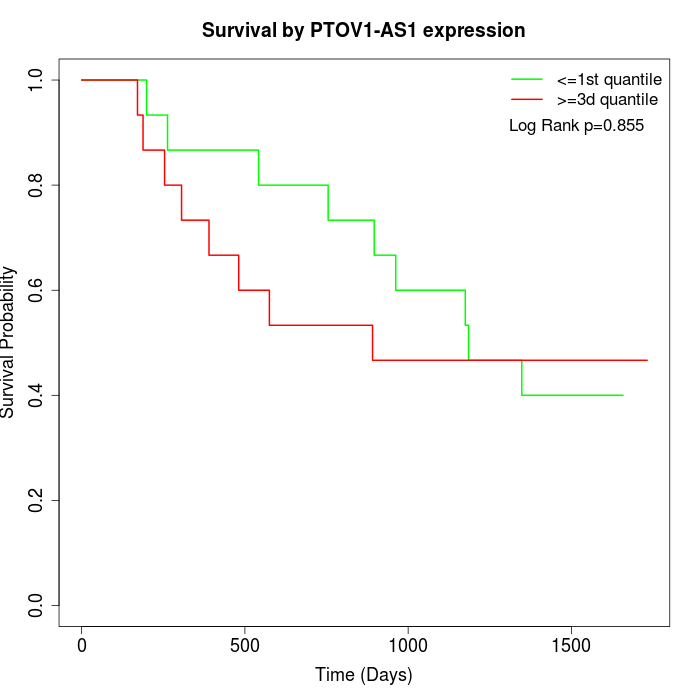 | 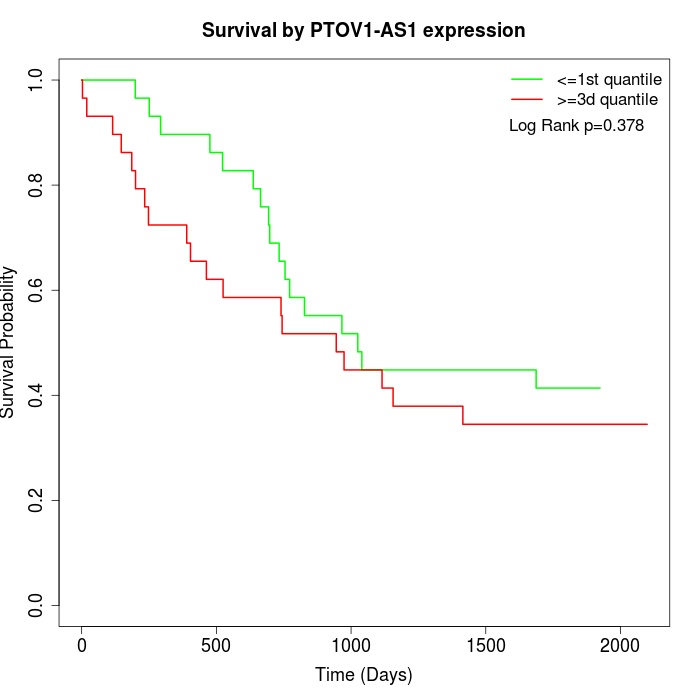 |
| GSE53622 | GSE53624 |
Note: Click image to view full size file.
Copy number change of PTOV1-AS1:
| Dataset | Gene | EntrezID | Gain | Loss | Normal | Detail |
|---|---|---|---|---|---|---|
| GSE15526 | PTOV1-AS1 | 100506033 | 4 | 4 | 22 | |
| GSE20123 | PTOV1-AS1 | 100506033 | 4 | 3 | 23 | |
| GSE43470 | PTOV1-AS1 | 100506033 | 5 | 11 | 27 | |
| GSE46452 | PTOV1-AS1 | 100506033 | 45 | 1 | 13 | |
| GSE47630 | PTOV1-AS1 | 100506033 | 10 | 6 | 24 | |
| GSE54993 | PTOV1-AS1 | 100506033 | 17 | 4 | 49 | |
| GSE54994 | PTOV1-AS1 | 100506033 | 4 | 14 | 35 | |
| GSE60625 | PTOV1-AS1 | 100506033 | 9 | 0 | 2 | |
| GSE74703 | PTOV1-AS1 | 100506033 | 5 | 7 | 24 | |
| GSE74704 | PTOV1-AS1 | 100506033 | 4 | 1 | 15 |
Total number of gains: 107; Total number of losses: 51; Total Number of normals: 234.
Somatic mutations of PTOV1-AS1:
Generating mutation plots.
Highly correlated genes for PTOV1-AS1:
Showing all 9 correlated genes with mean PCC>0.5.
| Gene1 | Gene2 | Mean PCC | Num. Datasets | Num. PCC<0 | Num. PCC>0.5 |
|---|---|---|---|---|---|
| PTOV1-AS1 | ZBTB20-AS1 | 0.641322 | 3 | 0 | 3 |
| PTOV1-AS1 | CEBPE | 0.574191 | 3 | 0 | 3 |
| PTOV1-AS1 | RSPH6A | 0.570958 | 4 | 0 | 3 |
| PTOV1-AS1 | FAAH | 0.570502 | 3 | 0 | 3 |
| PTOV1-AS1 | NFE4 | 0.556914 | 3 | 0 | 3 |
| PTOV1-AS1 | FGA | 0.545916 | 3 | 0 | 3 |
| PTOV1-AS1 | LRRC56 | 0.540955 | 4 | 0 | 3 |
| PTOV1-AS1 | VPS13A-AS1 | 0.525644 | 4 | 0 | 3 |
| PTOV1-AS1 | SLC24A4 | 0.512219 | 3 | 0 | 3 |
For details and further investigation, click here