| Full name: fibrinogen alpha chain | Alias Symbol: | ||
| Type: protein-coding gene | Cytoband: 4q31.3 | ||
| Entrez ID: 2243 | HGNC ID: HGNC:3661 | Ensembl Gene: ENSG00000171560 | OMIM ID: 134820 |
| Drug and gene relationship at DGIdb | |||
FGA involved pathways:
| KEGG pathway | Description | View |
|---|---|---|
| hsa04610 | Complement and coagulation cascades | |
| hsa04611 | Platelet activation |
Expression of FGA:
| Dataset | Gene | EntrezID | Probe | Log2FC | Adj.pValue | Expression |
|---|---|---|---|---|---|---|
| GSE17351 | FGA | 2243 | 231671_at | 0.1219 | 0.6244 | |
| GSE20347 | FGA | 2243 | 205650_s_at | -0.1106 | 0.1089 | |
| GSE23400 | FGA | 2243 | 205650_s_at | -0.2067 | 0.0000 | |
| GSE26886 | FGA | 2243 | 205650_s_at | -0.3681 | 0.0209 | |
| GSE29001 | FGA | 2243 | 205650_s_at | -0.3051 | 0.0134 | |
| GSE38129 | FGA | 2243 | 205650_s_at | -0.3035 | 0.0432 | |
| GSE45670 | FGA | 2243 | 205650_s_at | -0.0113 | 0.9275 | |
| GSE53622 | FGA | 2243 | 74401 | 0.0392 | 0.8901 | |
| GSE53624 | FGA | 2243 | 74401 | 0.2322 | 0.2362 | |
| GSE63941 | FGA | 2243 | 205650_s_at | 0.1255 | 0.4569 | |
| GSE77861 | FGA | 2243 | 205650_s_at | -0.2645 | 0.1420 | |
| GSE97050 | FGA | 2243 | A_23_P375372 | 0.1723 | 0.6211 | |
| TCGA | FGA | 2243 | RNAseq | -3.8613 | 0.0006 |
Upregulated datasets: 0; Downregulated datasets: 1.
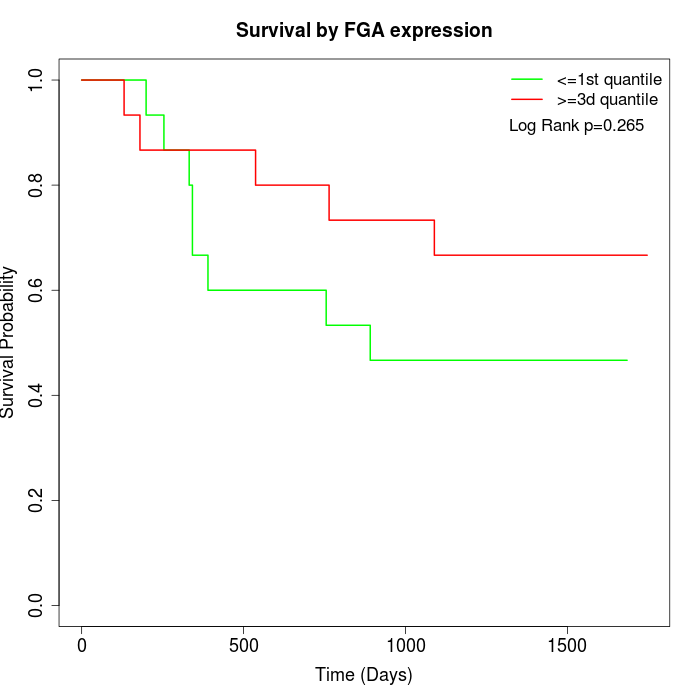
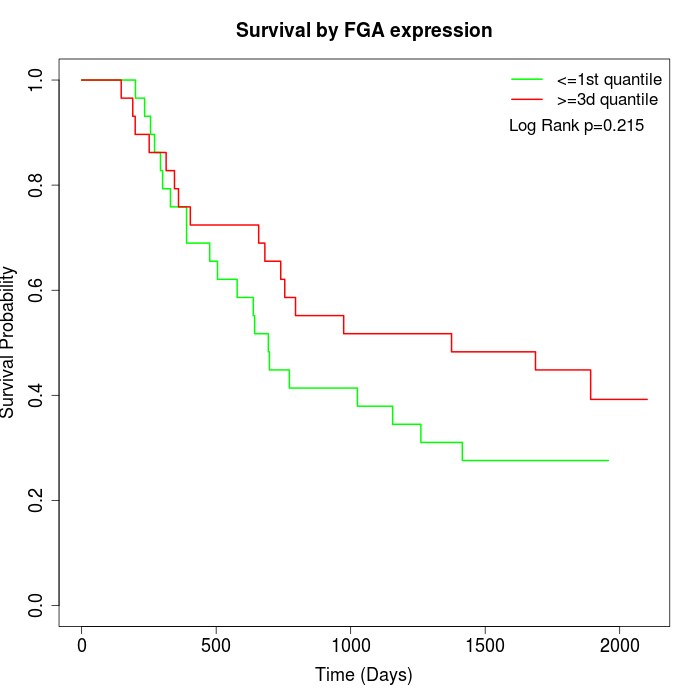
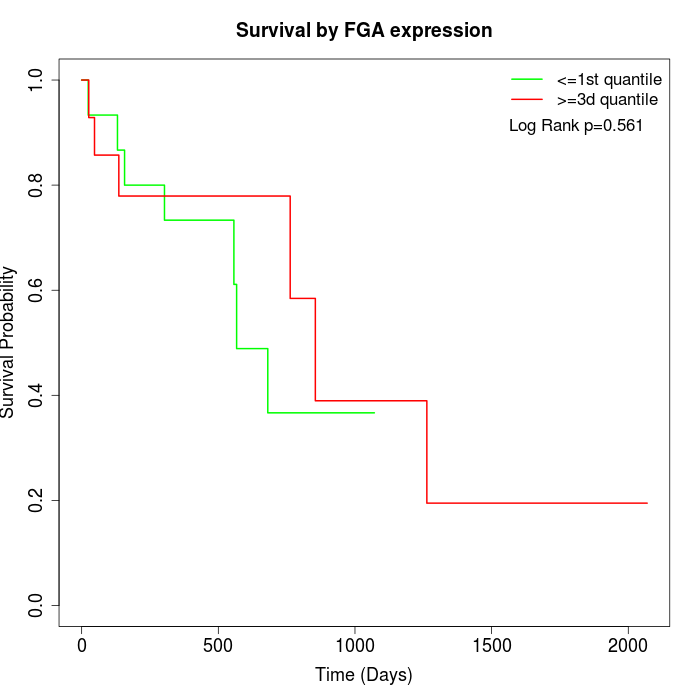
Survival by FGA expression:
Note: Click image to view full size file.
Copy number change of FGA:
| Dataset | Gene | EntrezID | Gain | Loss | Normal | Detail |
|---|---|---|---|---|---|---|
| GSE15526 | FGA | 2243 | 0 | 14 | 16 | |
| GSE20123 | FGA | 2243 | 0 | 14 | 16 | |
| GSE43470 | FGA | 2243 | 0 | 13 | 30 | |
| GSE46452 | FGA | 2243 | 1 | 36 | 22 | |
| GSE47630 | FGA | 2243 | 0 | 23 | 17 | |
| GSE54993 | FGA | 2243 | 10 | 0 | 60 | |
| GSE54994 | FGA | 2243 | 1 | 13 | 39 | |
| GSE60625 | FGA | 2243 | 0 | 1 | 10 | |
| GSE74703 | FGA | 2243 | 0 | 11 | 25 | |
| GSE74704 | FGA | 2243 | 0 | 7 | 13 | |
| TCGA | FGA | 2243 | 10 | 34 | 52 |
Total number of gains: 22; Total number of losses: 166; Total Number of normals: 300.
Somatic mutations of FGA:
Generating mutation plots.
Highly correlated genes for FGA:
Showing top 20/690 corelated genes with mean PCC>0.5.
| Gene1 | Gene2 | Mean PCC | Num. Datasets | Num. PCC<0 | Num. PCC>0.5 |
|---|---|---|---|---|---|
| FGA | IFNA16 | 0.729241 | 3 | 0 | 3 |
| FGA | OR51B5 | 0.708269 | 3 | 0 | 3 |
| FGA | SPX | 0.696268 | 3 | 0 | 3 |
| FGA | STAU2-AS1 | 0.68066 | 4 | 0 | 3 |
| FGA | LINC00689 | 0.677607 | 3 | 0 | 3 |
| FGA | PRL | 0.675592 | 4 | 0 | 4 |
| FGA | RIMS1 | 0.675555 | 4 | 0 | 3 |
| FGA | COLEC10 | 0.675077 | 4 | 0 | 4 |
| FGA | IFNA14 | 0.668974 | 4 | 0 | 4 |
| FGA | SLC22A13 | 0.668675 | 3 | 0 | 3 |
| FGA | IFNA7 | 0.666308 | 4 | 0 | 3 |
| FGA | CEACAM21 | 0.665651 | 4 | 0 | 4 |
| FGA | CGA | 0.664344 | 5 | 0 | 4 |
| FGA | LINC00943 | 0.663953 | 4 | 0 | 3 |
| FGA | ARMC4 | 0.660476 | 5 | 0 | 4 |
| FGA | IMPG2 | 0.658914 | 5 | 0 | 4 |
| FGA | STXBP5L | 0.650434 | 3 | 0 | 3 |
| FGA | FGG | 0.649339 | 7 | 0 | 5 |
| FGA | ATP4B | 0.647663 | 6 | 0 | 5 |
| FGA | HCRTR2 | 0.643865 | 3 | 0 | 3 |
For details and further investigation, click here


