| Full name: PTPRG antisense RNA 1 | Alias Symbol: | ||
| Type: non-coding RNA | Cytoband: 3p14.2 | ||
| Entrez ID: 100506994 | HGNC ID: HGNC:44638 | Ensembl Gene: ENSG00000241472 | OMIM ID: |
Expression of PTPRG-AS1:
| Dataset | Gene | EntrezID | Probe | Log2FC | Adj.pValue | Expression |
|---|---|---|---|---|---|---|
| GSE17351 | PTPRG-AS1 | 100506994 | 232242_at | 0.3918 | 0.4004 | |
| GSE26886 | PTPRG-AS1 | 100506994 | 232242_at | -0.0550 | 0.5594 | |
| GSE45670 | PTPRG-AS1 | 100506994 | 232242_at | 0.0921 | 0.6704 | |
| GSE53622 | PTPRG-AS1 | 100506994 | 66418 | 0.3218 | 0.0042 | |
| GSE53624 | PTPRG-AS1 | 100506994 | 20041 | 0.5666 | 0.0000 | |
| GSE63941 | PTPRG-AS1 | 100506994 | 232242_at | 0.1439 | 0.7495 | |
| GSE77861 | PTPRG-AS1 | 100506994 | 232242_at | 0.0758 | 0.4965 | |
| SRP133303 | PTPRG-AS1 | 100506994 | RNAseq | 0.3149 | 0.2223 | |
| SRP193095 | PTPRG-AS1 | 100506994 | RNAseq | 0.2729 | 0.0966 | |
| SRP219564 | PTPRG-AS1 | 100506994 | RNAseq | -0.1555 | 0.7243 |
Upregulated datasets: 0; Downregulated datasets: 0.
Survival by PTPRG-AS1 expression:
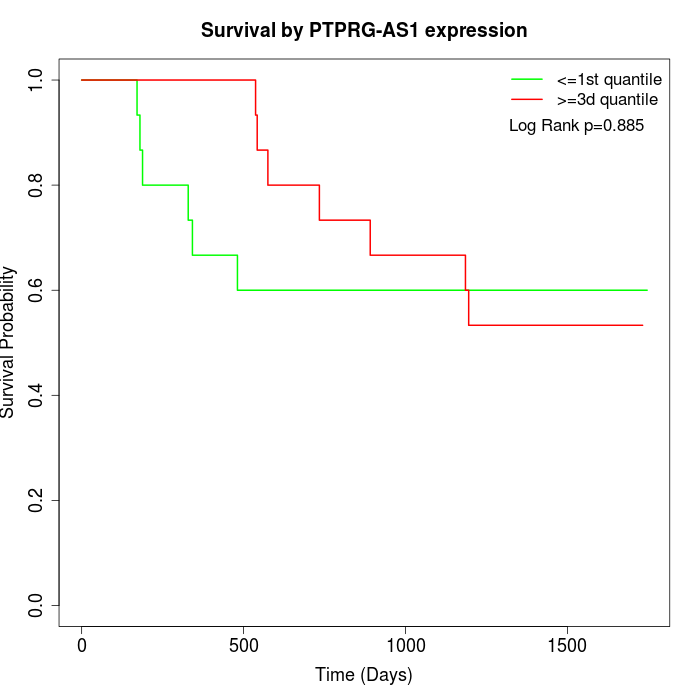 | 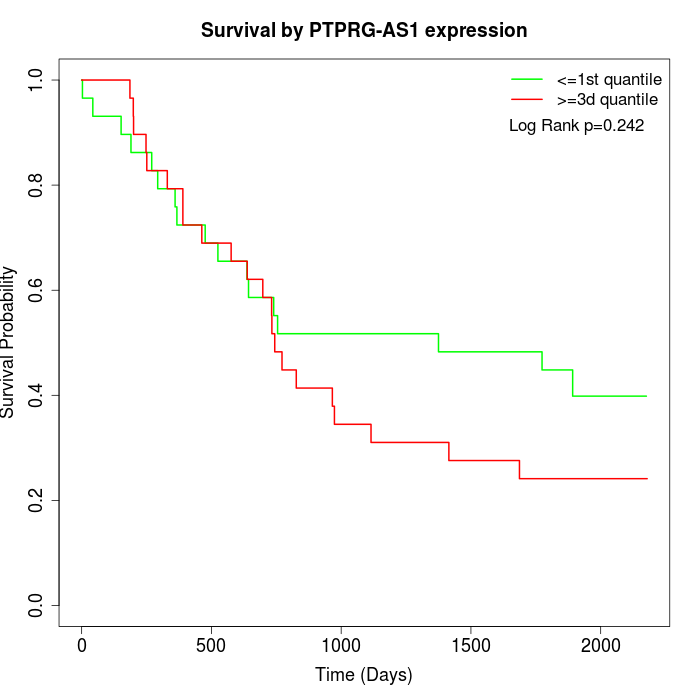 |
| GSE53622 | GSE53624 |
Note: Click image to view full size file.
Copy number change of PTPRG-AS1:
| Dataset | Gene | EntrezID | Gain | Loss | Normal | Detail |
|---|---|---|---|---|---|---|
| GSE15526 | PTPRG-AS1 | 100506994 | 0 | 18 | 12 | |
| GSE20123 | PTPRG-AS1 | 100506994 | 0 | 18 | 12 | |
| GSE43470 | PTPRG-AS1 | 100506994 | 0 | 19 | 24 | |
| GSE46452 | PTPRG-AS1 | 100506994 | 2 | 17 | 40 | |
| GSE47630 | PTPRG-AS1 | 100506994 | 1 | 24 | 15 | |
| GSE54993 | PTPRG-AS1 | 100506994 | 5 | 2 | 63 | |
| GSE54994 | PTPRG-AS1 | 100506994 | 1 | 32 | 20 | |
| GSE60625 | PTPRG-AS1 | 100506994 | 3 | 1 | 7 | |
| GSE74703 | PTPRG-AS1 | 100506994 | 0 | 16 | 20 | |
| GSE74704 | PTPRG-AS1 | 100506994 | 0 | 12 | 8 |
Total number of gains: 12; Total number of losses: 159; Total Number of normals: 221.
Somatic mutations of PTPRG-AS1:
Generating mutation plots.
Highly correlated genes for PTPRG-AS1:
Showing all 9 correlated genes with mean PCC>0.5.
| Gene1 | Gene2 | Mean PCC | Num. Datasets | Num. PCC<0 | Num. PCC>0.5 |
|---|---|---|---|---|---|
| PTPRG-AS1 | TTC6 | 0.699888 | 3 | 0 | 3 |
| PTPRG-AS1 | USP49 | 0.647319 | 3 | 0 | 3 |
| PTPRG-AS1 | CECR3 | 0.552908 | 3 | 0 | 3 |
| PTPRG-AS1 | FKBP7 | 0.547744 | 3 | 0 | 3 |
| PTPRG-AS1 | RAD51AP1 | 0.536244 | 3 | 0 | 3 |
| PTPRG-AS1 | SLBP | 0.52927 | 3 | 0 | 3 |
| PTPRG-AS1 | BFAR | 0.528712 | 4 | 0 | 3 |
| PTPRG-AS1 | TASP1 | 0.517107 | 3 | 0 | 3 |
| PTPRG-AS1 | EIF5A2 | 0.502562 | 4 | 0 | 3 |
For details and further investigation, click here