| Full name: RAD51 associated protein 1 | Alias Symbol: PIR51 | ||
| Type: protein-coding gene | Cytoband: 12p13.32 | ||
| Entrez ID: 10635 | HGNC ID: HGNC:16956 | Ensembl Gene: ENSG00000111247 | OMIM ID: 603070 |
Screen Evidence:
| |||
Expression of RAD51AP1:
| Dataset | Gene | EntrezID | Probe | Log2FC | Adj.pValue | Expression |
|---|---|---|---|---|---|---|
| GSE17351 | RAD51AP1 | 10635 | 204146_at | 1.5125 | 0.0265 | |
| GSE20347 | RAD51AP1 | 10635 | 204146_at | 2.0625 | 0.0000 | |
| GSE23400 | RAD51AP1 | 10635 | 204146_at | 1.1500 | 0.0000 | |
| GSE26886 | RAD51AP1 | 10635 | 204146_at | 1.2174 | 0.0131 | |
| GSE29001 | RAD51AP1 | 10635 | 204146_at | 2.1455 | 0.0001 | |
| GSE38129 | RAD51AP1 | 10635 | 204146_at | 2.2656 | 0.0000 | |
| GSE45670 | RAD51AP1 | 10635 | 204146_at | 1.3924 | 0.0000 | |
| GSE53622 | RAD51AP1 | 10635 | 51368 | 1.9354 | 0.0000 | |
| GSE53624 | RAD51AP1 | 10635 | 51368 | 2.1006 | 0.0000 | |
| GSE63941 | RAD51AP1 | 10635 | 204146_at | 3.2658 | 0.0000 | |
| GSE77861 | RAD51AP1 | 10635 | 204146_at | 1.7356 | 0.0071 | |
| GSE97050 | RAD51AP1 | 10635 | A_23_P99292 | 1.0442 | 0.1310 | |
| SRP007169 | RAD51AP1 | 10635 | RNAseq | 2.3258 | 0.0001 | |
| SRP008496 | RAD51AP1 | 10635 | RNAseq | 2.5034 | 0.0000 | |
| SRP133303 | RAD51AP1 | 10635 | RNAseq | 1.6338 | 0.0000 | |
| SRP159526 | RAD51AP1 | 10635 | RNAseq | 1.6221 | 0.0000 | |
| SRP193095 | RAD51AP1 | 10635 | RNAseq | 1.0792 | 0.0000 | |
| SRP219564 | RAD51AP1 | 10635 | RNAseq | 1.5639 | 0.0097 | |
| TCGA | RAD51AP1 | 10635 | RNAseq | 1.2015 | 0.0000 |
Upregulated datasets: 18; Downregulated datasets: 0.
Survival by RAD51AP1 expression:
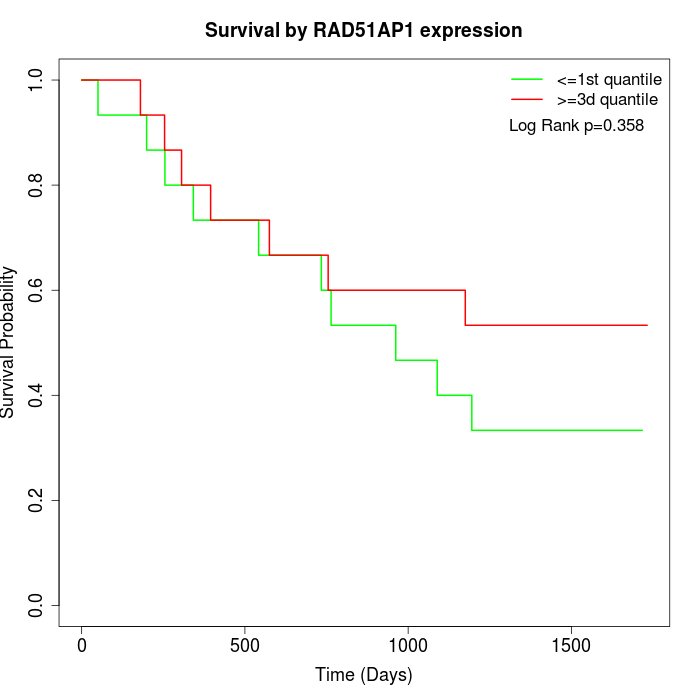 |  | 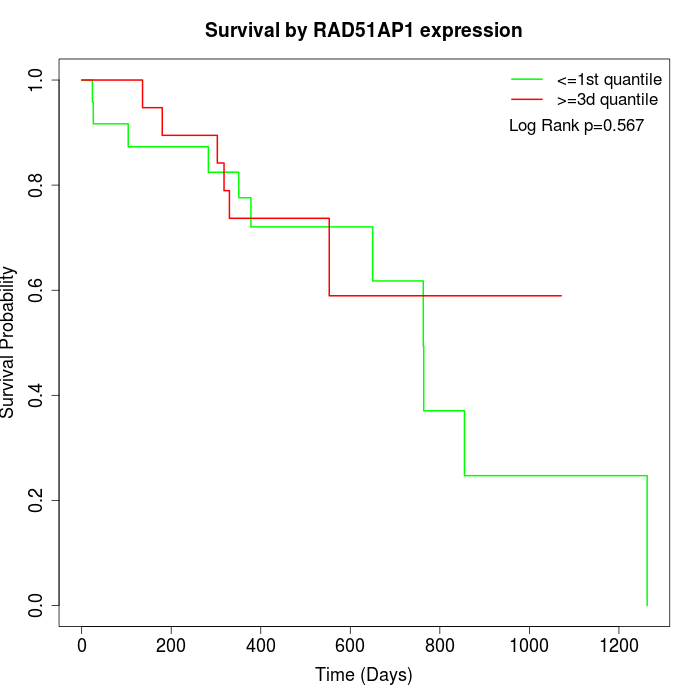 |
| GSE53622 | GSE53624 | TCGA |
Note: Click image to view full size file.
Copy number change of RAD51AP1:
| Dataset | Gene | EntrezID | Gain | Loss | Normal | Detail |
|---|---|---|---|---|---|---|
| GSE15526 | RAD51AP1 | 10635 | 6 | 4 | 20 | |
| GSE20123 | RAD51AP1 | 10635 | 6 | 4 | 20 | |
| GSE43470 | RAD51AP1 | 10635 | 10 | 3 | 30 | |
| GSE46452 | RAD51AP1 | 10635 | 10 | 1 | 48 | |
| GSE47630 | RAD51AP1 | 10635 | 12 | 2 | 26 | |
| GSE54993 | RAD51AP1 | 10635 | 1 | 10 | 59 | |
| GSE54994 | RAD51AP1 | 10635 | 10 | 2 | 41 | |
| GSE60625 | RAD51AP1 | 10635 | 0 | 1 | 10 | |
| GSE74703 | RAD51AP1 | 10635 | 9 | 2 | 25 | |
| GSE74704 | RAD51AP1 | 10635 | 4 | 2 | 14 | |
| TCGA | RAD51AP1 | 10635 | 40 | 6 | 50 |
Total number of gains: 108; Total number of losses: 37; Total Number of normals: 343.
Somatic mutations of RAD51AP1:
Generating mutation plots.
Highly correlated genes for RAD51AP1:
Showing top 20/1836 corelated genes with mean PCC>0.5.
| Gene1 | Gene2 | Mean PCC | Num. Datasets | Num. PCC<0 | Num. PCC>0.5 |
|---|---|---|---|---|---|
| RAD51AP1 | CDK1 | 0.885404 | 12 | 0 | 12 |
| RAD51AP1 | FOXM1 | 0.881399 | 13 | 0 | 12 |
| RAD51AP1 | ECT2 | 0.858846 | 13 | 0 | 13 |
| RAD51AP1 | NCAPH | 0.854781 | 9 | 0 | 9 |
| RAD51AP1 | NEK2 | 0.853549 | 13 | 0 | 13 |
| RAD51AP1 | MCM2 | 0.841935 | 13 | 0 | 13 |
| RAD51AP1 | RFC4 | 0.837325 | 13 | 0 | 13 |
| RAD51AP1 | UBE2T | 0.836944 | 9 | 0 | 9 |
| RAD51AP1 | MCM6 | 0.834191 | 12 | 0 | 12 |
| RAD51AP1 | CDC6 | 0.832457 | 9 | 0 | 9 |
| RAD51AP1 | MAD2L1 | 0.832361 | 13 | 0 | 13 |
| RAD51AP1 | BUB1 | 0.831898 | 11 | 0 | 10 |
| RAD51AP1 | NCAPD2 | 0.830949 | 12 | 0 | 12 |
| RAD51AP1 | TPX2 | 0.830151 | 13 | 0 | 13 |
| RAD51AP1 | CENPF | 0.829114 | 13 | 0 | 12 |
| RAD51AP1 | KIF14 | 0.829077 | 13 | 0 | 13 |
| RAD51AP1 | STIL | 0.828226 | 12 | 0 | 12 |
| RAD51AP1 | MTFR2 | 0.827161 | 7 | 0 | 7 |
| RAD51AP1 | BUB1B | 0.823414 | 11 | 0 | 11 |
| RAD51AP1 | TIMELESS | 0.821067 | 13 | 0 | 13 |
For details and further investigation, click here