| Full name: ITGA9 antisense RNA 1 | Alias Symbol: | ||
| Type: non-coding RNA | Cytoband: 3p22.2 | ||
| Entrez ID: 101928153 | HGNC ID: HGNC:49668 | Ensembl Gene: ENSG00000235257 | OMIM ID: |
Expression of ITGA9-AS1:
| Dataset | Gene | EntrezID | Probe | Log2FC | Adj.pValue | Expression |
|---|---|---|---|---|---|---|
| GSE17351 | ITGA9-AS1 | 101928153 | 1563635_at | 0.0595 | 0.8991 | |
| GSE26886 | ITGA9-AS1 | 101928153 | 1563635_at | -0.1280 | 0.2381 | |
| GSE45670 | ITGA9-AS1 | 101928153 | 1563635_at | -0.4663 | 0.0142 | |
| GSE53622 | ITGA9-AS1 | 101928153 | 1654 | 0.7609 | 0.0000 | |
| GSE53624 | ITGA9-AS1 | 101928153 | 1654 | 0.7803 | 0.0000 | |
| GSE63941 | ITGA9-AS1 | 101928153 | 1563635_at | 0.1146 | 0.6256 | |
| GSE77861 | ITGA9-AS1 | 101928153 | 1563635_at | -0.1314 | 0.0577 | |
| SRP133303 | ITGA9-AS1 | 101928153 | RNAseq | -1.1688 | 0.0006 | |
| SRP159526 | ITGA9-AS1 | 101928153 | RNAseq | -1.2604 | 0.0094 | |
| SRP219564 | ITGA9-AS1 | 101928153 | RNAseq | -0.9105 | 0.0448 |
Upregulated datasets: 0; Downregulated datasets: 2.
Survival by ITGA9-AS1 expression:
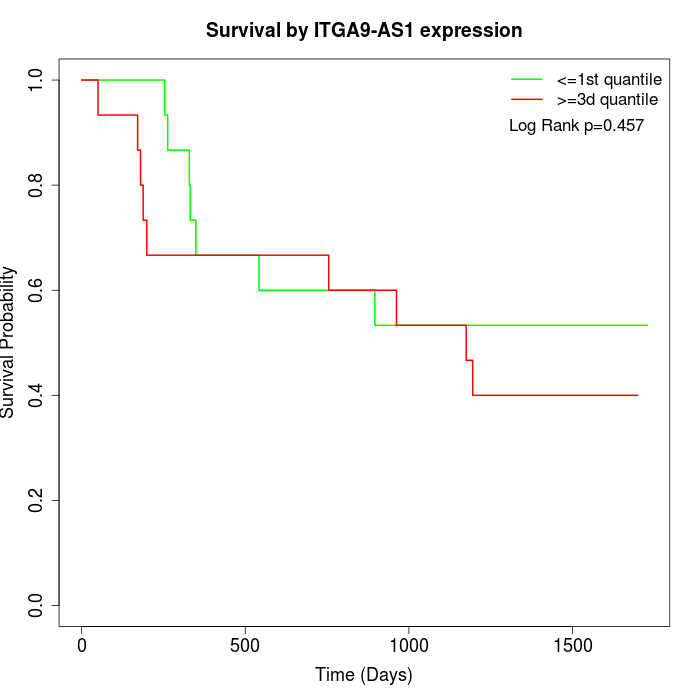 | 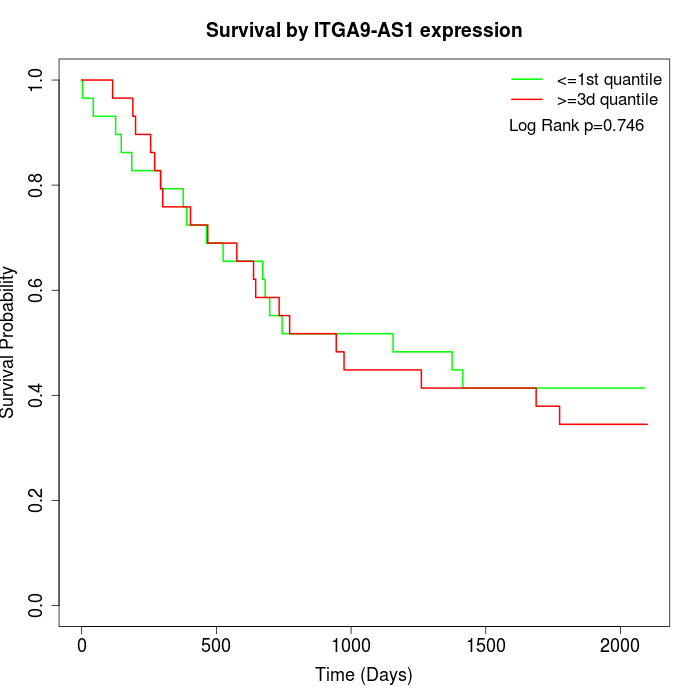 |
| GSE53622 | GSE53624 |
Note: Click image to view full size file.
Copy number change of ITGA9-AS1:
| Dataset | Gene | EntrezID | Gain | Loss | Normal | Detail |
|---|---|---|---|---|---|---|
| GSE15526 | ITGA9-AS1 | 101928153 | 0 | 19 | 11 | |
| GSE20123 | ITGA9-AS1 | 101928153 | 0 | 19 | 11 | |
| GSE43470 | ITGA9-AS1 | 101928153 | 0 | 20 | 23 | |
| GSE46452 | ITGA9-AS1 | 101928153 | 2 | 17 | 40 | |
| GSE47630 | ITGA9-AS1 | 101928153 | 1 | 25 | 14 | |
| GSE54993 | ITGA9-AS1 | 101928153 | 6 | 3 | 61 | |
| GSE54994 | ITGA9-AS1 | 101928153 | 1 | 32 | 20 | |
| GSE60625 | ITGA9-AS1 | 101928153 | 5 | 0 | 6 | |
| GSE74703 | ITGA9-AS1 | 101928153 | 0 | 16 | 20 | |
| GSE74704 | ITGA9-AS1 | 101928153 | 0 | 13 | 7 |
Total number of gains: 15; Total number of losses: 164; Total Number of normals: 213.
Somatic mutations of ITGA9-AS1:
Generating mutation plots.
Highly correlated genes for ITGA9-AS1:
Showing all 16 correlated genes with mean PCC>0.5.
| Gene1 | Gene2 | Mean PCC | Num. Datasets | Num. PCC<0 | Num. PCC>0.5 |
|---|---|---|---|---|---|
| ITGA9-AS1 | FAM200B | 0.665158 | 3 | 0 | 3 |
| ITGA9-AS1 | MBNL3 | 0.620946 | 3 | 0 | 3 |
| ITGA9-AS1 | CSHL1 | 0.599399 | 3 | 0 | 3 |
| ITGA9-AS1 | TDRD3 | 0.592507 | 3 | 0 | 3 |
| ITGA9-AS1 | KIFC2 | 0.591204 | 3 | 0 | 3 |
| ITGA9-AS1 | PFKFB2 | 0.589192 | 3 | 0 | 3 |
| ITGA9-AS1 | HYMAI | 0.583313 | 3 | 0 | 3 |
| ITGA9-AS1 | HNRNPA3 | 0.561025 | 3 | 0 | 3 |
| ITGA9-AS1 | GXYLT1 | 0.555312 | 3 | 0 | 3 |
| ITGA9-AS1 | ZNF585A | 0.553768 | 5 | 0 | 3 |
| ITGA9-AS1 | FOXP4 | 0.549911 | 3 | 0 | 3 |
| ITGA9-AS1 | PCMTD1 | 0.538525 | 3 | 0 | 3 |
| ITGA9-AS1 | DLGAP4 | 0.536514 | 3 | 0 | 3 |
| ITGA9-AS1 | ARHGAP33 | 0.533941 | 4 | 0 | 3 |
| ITGA9-AS1 | NISCH | 0.52655 | 4 | 0 | 3 |
| ITGA9-AS1 | CCDC171 | 0.518288 | 4 | 0 | 3 |
For details and further investigation, click here