| Full name: calcium dependent secretion activator | Alias Symbol: CAPS|KIAA1121|CAPS1|UNC-31 | ||
| Type: protein-coding gene | Cytoband: 3p14.2 | ||
| Entrez ID: 8618 | HGNC ID: HGNC:1426 | Ensembl Gene: ENSG00000163618 | OMIM ID: 604667 |
Expression of CADPS:
| Dataset | Gene | EntrezID | Probe | Log2FC | Adj.pValue | Expression |
|---|---|---|---|---|---|---|
| GSE17351 | CADPS | 8618 | 1568604_a_at | -0.1383 | 0.6334 | |
| GSE20347 | CADPS | 8618 | 204814_at | -0.0432 | 0.4052 | |
| GSE23400 | CADPS | 8618 | 204814_at | -0.0666 | 0.0107 | |
| GSE26886 | CADPS | 8618 | 233950_at | 0.1329 | 0.0903 | |
| GSE29001 | CADPS | 8618 | 204814_at | -0.1571 | 0.3127 | |
| GSE38129 | CADPS | 8618 | 204814_at | -0.1674 | 0.0129 | |
| GSE45670 | CADPS | 8618 | 233950_at | -0.0089 | 0.9293 | |
| GSE53622 | CADPS | 8618 | 3842 | 0.2217 | 0.0025 | |
| GSE53624 | CADPS | 8618 | 3842 | 0.2145 | 0.0067 | |
| GSE63941 | CADPS | 8618 | 1568604_a_at | -2.1376 | 0.0000 | |
| GSE77861 | CADPS | 8618 | 233950_at | -0.0389 | 0.6757 | |
| GSE97050 | CADPS | 8618 | A_33_P3356290 | 0.0330 | 0.8783 | |
| SRP133303 | CADPS | 8618 | RNAseq | -0.2909 | 0.5126 | |
| TCGA | CADPS | 8618 | RNAseq | -2.7020 | 0.0000 |
Upregulated datasets: 0; Downregulated datasets: 2.
Survival by CADPS expression:
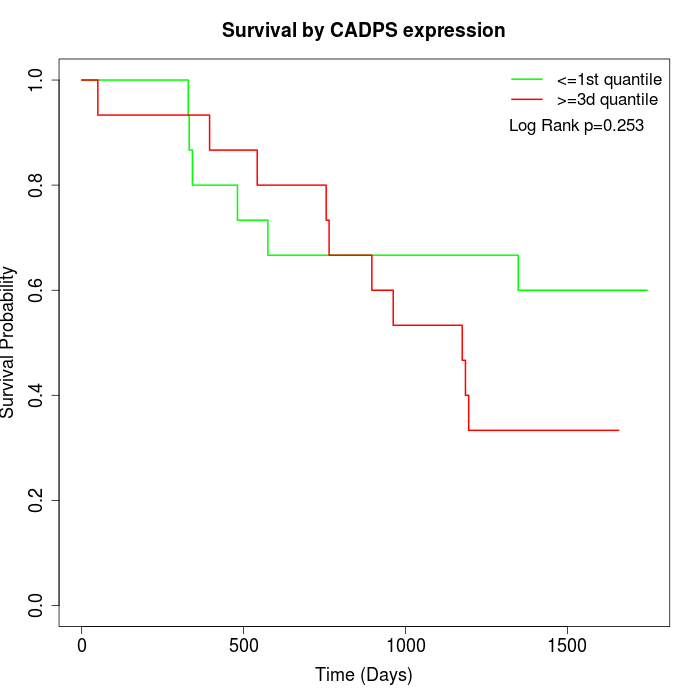 | 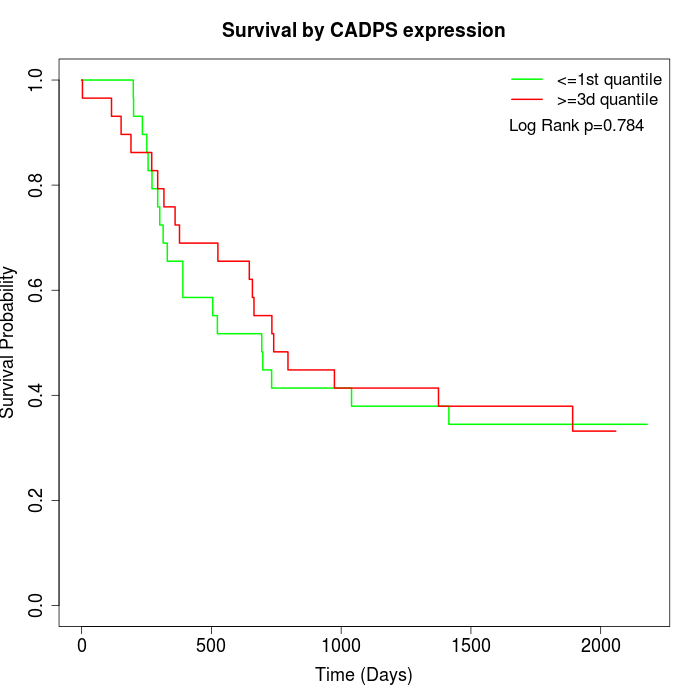 | 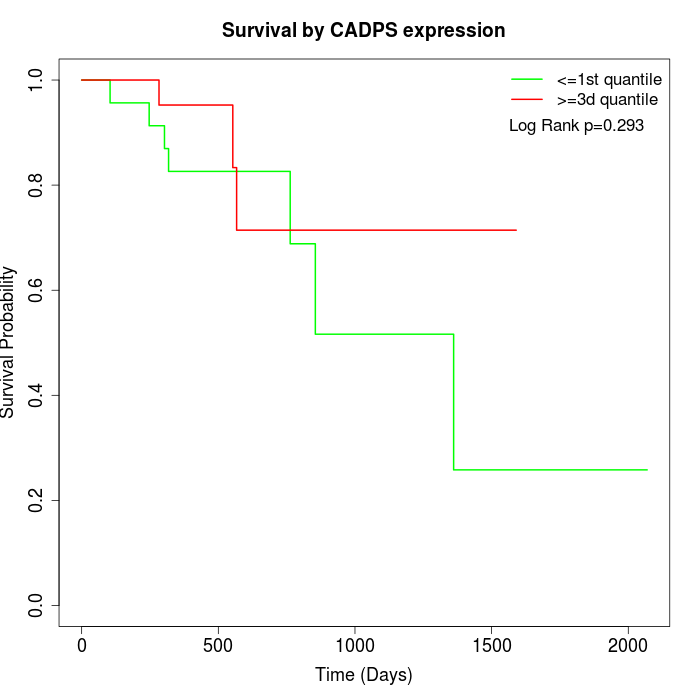 |
| GSE53622 | GSE53624 | TCGA |
Note: Click image to view full size file.
Copy number change of CADPS:
| Dataset | Gene | EntrezID | Gain | Loss | Normal | Detail |
|---|---|---|---|---|---|---|
| GSE15526 | CADPS | 8618 | 0 | 18 | 12 | |
| GSE20123 | CADPS | 8618 | 0 | 18 | 12 | |
| GSE43470 | CADPS | 8618 | 0 | 19 | 24 | |
| GSE46452 | CADPS | 8618 | 2 | 17 | 40 | |
| GSE47630 | CADPS | 8618 | 1 | 24 | 15 | |
| GSE54993 | CADPS | 8618 | 5 | 2 | 63 | |
| GSE54994 | CADPS | 8618 | 1 | 33 | 19 | |
| GSE60625 | CADPS | 8618 | 3 | 1 | 7 | |
| GSE74703 | CADPS | 8618 | 0 | 16 | 20 | |
| GSE74704 | CADPS | 8618 | 0 | 12 | 8 | |
| TCGA | CADPS | 8618 | 0 | 79 | 17 |
Total number of gains: 12; Total number of losses: 239; Total Number of normals: 237.
Somatic mutations of CADPS:
Generating mutation plots.
Highly correlated genes for CADPS:
Showing top 20/532 corelated genes with mean PCC>0.5.
| Gene1 | Gene2 | Mean PCC | Num. Datasets | Num. PCC<0 | Num. PCC>0.5 |
|---|---|---|---|---|---|
| CADPS | TCEAL7 | 0.854364 | 3 | 0 | 3 |
| CADPS | RBM43 | 0.795355 | 4 | 0 | 4 |
| CADPS | C1QL2 | 0.792578 | 3 | 0 | 3 |
| CADPS | YY2 | 0.790743 | 3 | 0 | 3 |
| CADPS | PRSS38 | 0.790295 | 3 | 0 | 3 |
| CADPS | BBC3 | 0.786822 | 3 | 0 | 3 |
| CADPS | DCDC1 | 0.784875 | 3 | 0 | 3 |
| CADPS | OR2T1 | 0.784038 | 3 | 0 | 3 |
| CADPS | INSC | 0.783506 | 4 | 0 | 4 |
| CADPS | BSX | 0.775496 | 3 | 0 | 3 |
| CADPS | MRGPRG | 0.763945 | 3 | 0 | 3 |
| CADPS | USP51 | 0.763074 | 4 | 0 | 4 |
| CADPS | SETDB2 | 0.761757 | 3 | 0 | 3 |
| CADPS | OR2T27 | 0.757894 | 3 | 0 | 3 |
| CADPS | GPR182 | 0.753522 | 5 | 0 | 4 |
| CADPS | MS4A18 | 0.748524 | 3 | 0 | 3 |
| CADPS | LYZL2 | 0.743566 | 3 | 0 | 3 |
| CADPS | IL21 | 0.743159 | 4 | 0 | 4 |
| CADPS | LCN9 | 0.742241 | 3 | 0 | 3 |
| CADPS | FAM131A | 0.739075 | 3 | 0 | 3 |
For details and further investigation, click here