| Full name: G protein subunit alpha transducin 1 | Alias Symbol: CSNBAD3 | ||
| Type: protein-coding gene | Cytoband: 3p21.31 | ||
| Entrez ID: 2779 | HGNC ID: HGNC:4393 | Ensembl Gene: ENSG00000114349 | OMIM ID: 139330 |
Expression of GNAT1:
| Dataset | Gene | EntrezID | Probe | Log2FC | Adj.pValue | Expression |
|---|---|---|---|---|---|---|
| GSE17351 | GNAT1 | 2779 | 214286_at | 0.0531 | 0.8684 | |
| GSE20347 | GNAT1 | 2779 | 214286_at | 0.0163 | 0.8712 | |
| GSE23400 | GNAT1 | 2779 | 214286_at | -0.1126 | 0.0040 | |
| GSE26886 | GNAT1 | 2779 | 207514_s_at | 0.1677 | 0.1964 | |
| GSE29001 | GNAT1 | 2779 | 207514_s_at | -0.1852 | 0.0789 | |
| GSE38129 | GNAT1 | 2779 | 214286_at | -0.0495 | 0.6917 | |
| GSE45670 | GNAT1 | 2779 | 214286_at | 0.1322 | 0.1555 | |
| GSE53622 | GNAT1 | 2779 | 92878 | -0.3790 | 0.0034 | |
| GSE53624 | GNAT1 | 2779 | 92878 | -0.0834 | 0.4383 | |
| GSE63941 | GNAT1 | 2779 | 214286_at | 0.1136 | 0.4015 | |
| GSE77861 | GNAT1 | 2779 | 207514_s_at | -0.0258 | 0.8345 | |
| SRP133303 | GNAT1 | 2779 | RNAseq | -0.0127 | 0.9260 | |
| SRP159526 | GNAT1 | 2779 | RNAseq | 0.2223 | 0.7516 | |
| SRP193095 | GNAT1 | 2779 | RNAseq | -0.1663 | 0.2684 | |
| SRP219564 | GNAT1 | 2779 | RNAseq | -0.1523 | 0.7611 | |
| TCGA | GNAT1 | 2779 | RNAseq | 0.5533 | 0.5870 |
Upregulated datasets: 0; Downregulated datasets: 0.
Survival by GNAT1 expression:
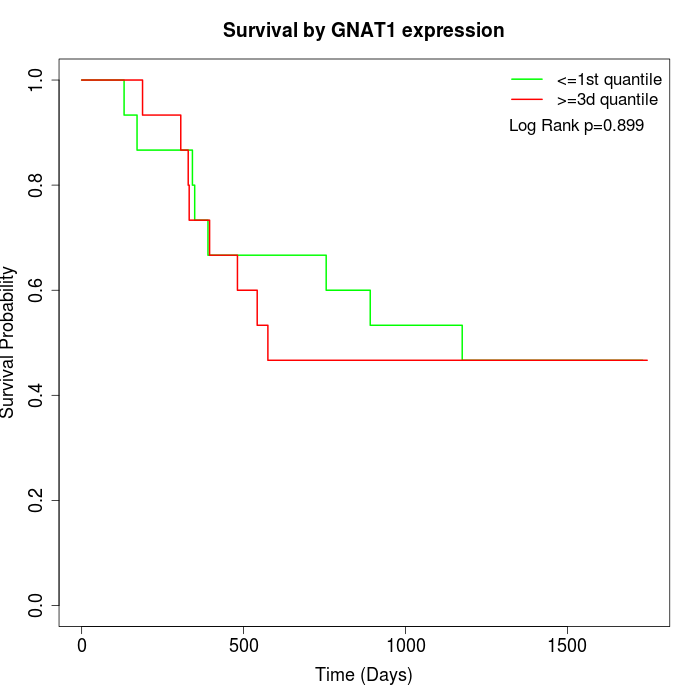 | 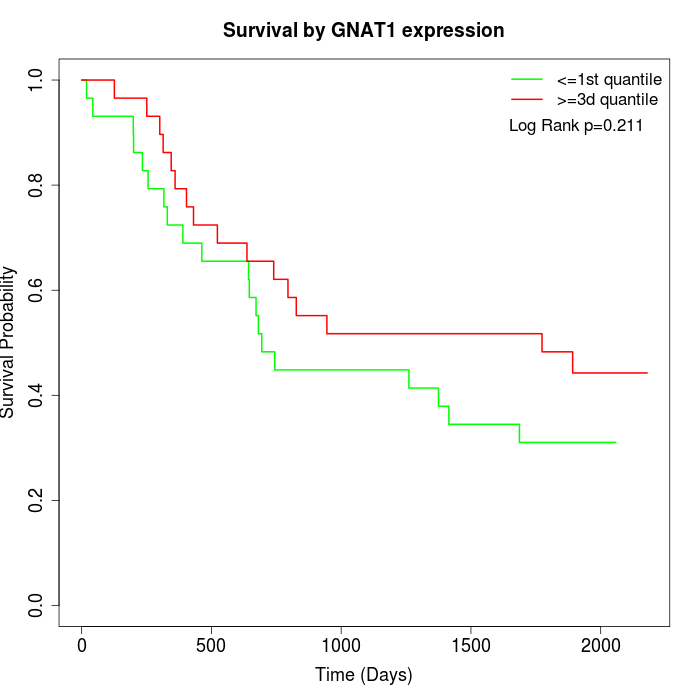 |  |
| GSE53622 | GSE53624 | TCGA |
Note: Click image to view full size file.
Copy number change of GNAT1:
| Dataset | Gene | EntrezID | Gain | Loss | Normal | Detail |
|---|---|---|---|---|---|---|
| GSE15526 | GNAT1 | 2779 | 0 | 18 | 12 | |
| GSE20123 | GNAT1 | 2779 | 0 | 19 | 11 | |
| GSE43470 | GNAT1 | 2779 | 0 | 19 | 24 | |
| GSE46452 | GNAT1 | 2779 | 2 | 16 | 41 | |
| GSE47630 | GNAT1 | 2779 | 1 | 24 | 15 | |
| GSE54993 | GNAT1 | 2779 | 6 | 2 | 62 | |
| GSE54994 | GNAT1 | 2779 | 1 | 33 | 19 | |
| GSE60625 | GNAT1 | 2779 | 5 | 0 | 6 | |
| GSE74703 | GNAT1 | 2779 | 0 | 15 | 21 | |
| GSE74704 | GNAT1 | 2779 | 0 | 12 | 8 | |
| TCGA | GNAT1 | 2779 | 0 | 78 | 18 |
Total number of gains: 15; Total number of losses: 236; Total Number of normals: 237.
Somatic mutations of GNAT1:
Generating mutation plots.
Highly correlated genes for GNAT1:
Showing top 20/1029 corelated genes with mean PCC>0.5.
| Gene1 | Gene2 | Mean PCC | Num. Datasets | Num. PCC<0 | Num. PCC>0.5 |
|---|---|---|---|---|---|
| GNAT1 | CDHR5 | 0.744499 | 3 | 0 | 3 |
| GNAT1 | KSR1 | 0.74045 | 4 | 0 | 4 |
| GNAT1 | NRG1 | 0.737981 | 4 | 0 | 4 |
| GNAT1 | ITGB3 | 0.719152 | 4 | 0 | 4 |
| GNAT1 | ZNF771 | 0.716841 | 3 | 0 | 3 |
| GNAT1 | ELFN1 | 0.715398 | 3 | 0 | 3 |
| GNAT1 | SLC39A5 | 0.703481 | 3 | 0 | 3 |
| GNAT1 | RBBP8NL | 0.700445 | 4 | 0 | 3 |
| GNAT1 | KRT76 | 0.687436 | 4 | 0 | 4 |
| GNAT1 | PRR34 | 0.686911 | 5 | 0 | 5 |
| GNAT1 | AMN | 0.685486 | 7 | 0 | 7 |
| GNAT1 | VCX2 | 0.684488 | 6 | 0 | 5 |
| GNAT1 | TREML1 | 0.680534 | 3 | 0 | 3 |
| GNAT1 | EPOR | 0.679563 | 6 | 0 | 5 |
| GNAT1 | RPRML | 0.67526 | 3 | 0 | 3 |
| GNAT1 | PHLDB1 | 0.674958 | 5 | 0 | 4 |
| GNAT1 | SLC45A2 | 0.673864 | 5 | 0 | 5 |
| GNAT1 | LUZP4 | 0.671721 | 4 | 0 | 4 |
| GNAT1 | DLGAP3 | 0.669308 | 4 | 0 | 4 |
| GNAT1 | ART1 | 0.668976 | 6 | 0 | 5 |
For details and further investigation, click here