| Full name: MYC binding protein 2 | Alias Symbol: PAM|KIAA0916|FLJ10106|PHR1 | ||
| Type: protein-coding gene | Cytoband: 13q22.3 | ||
| Entrez ID: 23077 | HGNC ID: HGNC:23386 | Ensembl Gene: ENSG00000005810 | OMIM ID: 610392 |
Expression of MYCBP2:
| Dataset | Gene | EntrezID | Probe | Log2FC | Adj.pValue | Expression |
|---|---|---|---|---|---|---|
| GSE17351 | MYCBP2 | 23077 | 201960_s_at | -0.2342 | 0.7016 | |
| GSE20347 | MYCBP2 | 23077 | 201960_s_at | -0.7621 | 0.0043 | |
| GSE23400 | MYCBP2 | 23077 | 201960_s_at | -0.4892 | 0.0000 | |
| GSE26886 | MYCBP2 | 23077 | 201960_s_at | -0.1403 | 0.4831 | |
| GSE29001 | MYCBP2 | 23077 | 201960_s_at | -0.3886 | 0.1289 | |
| GSE38129 | MYCBP2 | 23077 | 201960_s_at | -0.7742 | 0.0004 | |
| GSE45670 | MYCBP2 | 23077 | 201960_s_at | -0.1450 | 0.4333 | |
| GSE53622 | MYCBP2 | 23077 | 104827 | -0.6309 | 0.0000 | |
| GSE53624 | MYCBP2 | 23077 | 104827 | -0.7601 | 0.0000 | |
| GSE63941 | MYCBP2 | 23077 | 201960_s_at | -1.2820 | 0.0156 | |
| GSE77861 | MYCBP2 | 23077 | 201960_s_at | -0.7758 | 0.0252 | |
| GSE97050 | MYCBP2 | 23077 | A_23_P151459 | -0.1415 | 0.6923 | |
| SRP007169 | MYCBP2 | 23077 | RNAseq | -0.1663 | 0.7019 | |
| SRP008496 | MYCBP2 | 23077 | RNAseq | -0.0641 | 0.8443 | |
| SRP064894 | MYCBP2 | 23077 | RNAseq | -0.6953 | 0.0061 | |
| SRP133303 | MYCBP2 | 23077 | RNAseq | -0.2250 | 0.4494 | |
| SRP159526 | MYCBP2 | 23077 | RNAseq | -1.2402 | 0.0197 | |
| SRP193095 | MYCBP2 | 23077 | RNAseq | -0.7807 | 0.0000 | |
| SRP219564 | MYCBP2 | 23077 | RNAseq | -0.6043 | 0.1366 | |
| TCGA | MYCBP2 | 23077 | RNAseq | -0.0398 | 0.5132 |
Upregulated datasets: 0; Downregulated datasets: 2.
Survival by MYCBP2 expression:
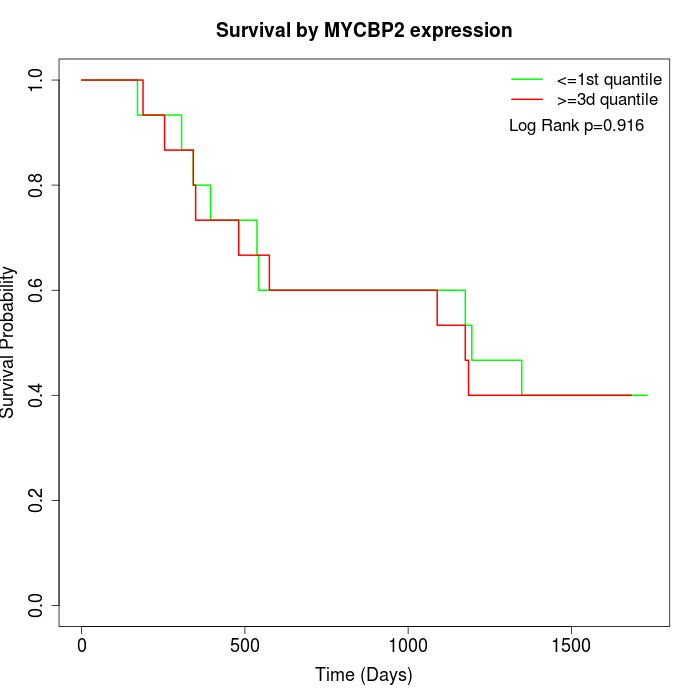 | 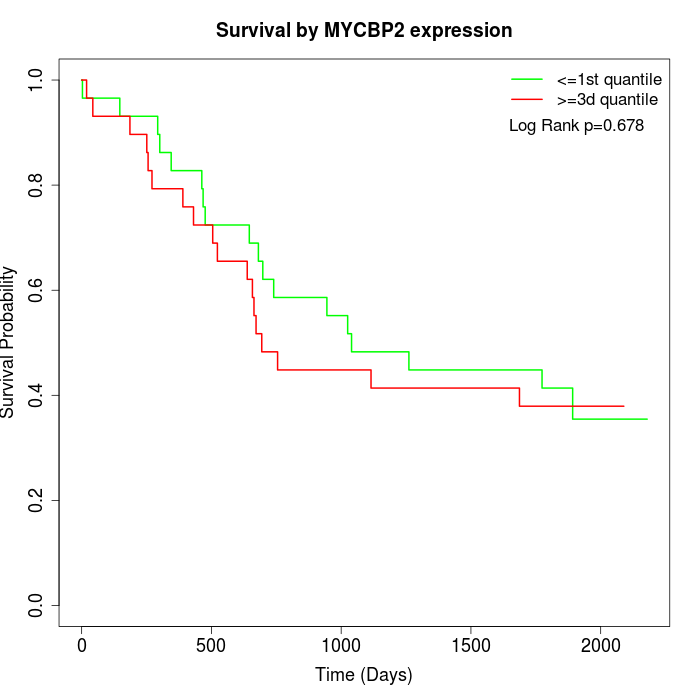 | 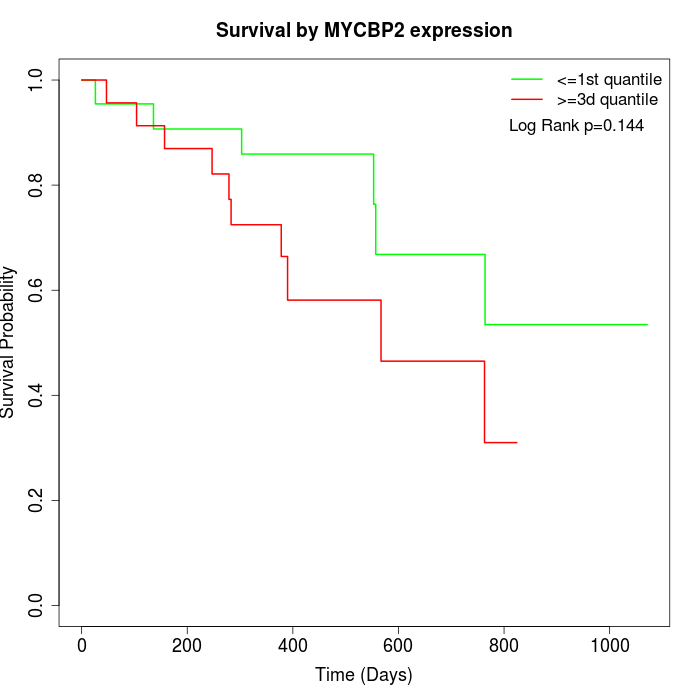 |
| GSE53622 | GSE53624 | TCGA |
Note: Click image to view full size file.
Copy number change of MYCBP2:
| Dataset | Gene | EntrezID | Gain | Loss | Normal | Detail |
|---|---|---|---|---|---|---|
| GSE15526 | MYCBP2 | 23077 | 3 | 11 | 16 | |
| GSE20123 | MYCBP2 | 23077 | 3 | 10 | 17 | |
| GSE43470 | MYCBP2 | 23077 | 4 | 11 | 28 | |
| GSE46452 | MYCBP2 | 23077 | 0 | 32 | 27 | |
| GSE47630 | MYCBP2 | 23077 | 3 | 27 | 10 | |
| GSE54993 | MYCBP2 | 23077 | 11 | 3 | 56 | |
| GSE54994 | MYCBP2 | 23077 | 3 | 15 | 35 | |
| GSE60625 | MYCBP2 | 23077 | 0 | 3 | 8 | |
| GSE74703 | MYCBP2 | 23077 | 3 | 9 | 24 | |
| GSE74704 | MYCBP2 | 23077 | 1 | 9 | 10 | |
| TCGA | MYCBP2 | 23077 | 12 | 33 | 51 |
Total number of gains: 43; Total number of losses: 163; Total Number of normals: 282.
Somatic mutations of MYCBP2:
Generating mutation plots.
Highly correlated genes for MYCBP2:
Showing top 20/791 corelated genes with mean PCC>0.5.
| Gene1 | Gene2 | Mean PCC | Num. Datasets | Num. PCC<0 | Num. PCC>0.5 |
|---|---|---|---|---|---|
| MYCBP2 | BIVM | 0.748974 | 3 | 0 | 3 |
| MYCBP2 | MUC15 | 0.706897 | 3 | 0 | 3 |
| MYCBP2 | COG3 | 0.706167 | 4 | 0 | 4 |
| MYCBP2 | ZNF320 | 0.70593 | 4 | 0 | 4 |
| MYCBP2 | RAB10 | 0.703054 | 3 | 0 | 3 |
| MYCBP2 | LYNX1 | 0.699135 | 3 | 0 | 3 |
| MYCBP2 | CYSRT1 | 0.696135 | 3 | 0 | 3 |
| MYCBP2 | ZNF566 | 0.692848 | 3 | 0 | 3 |
| MYCBP2 | ZNF416 | 0.691411 | 3 | 0 | 3 |
| MYCBP2 | SAMD9L | 0.690807 | 3 | 0 | 3 |
| MYCBP2 | ZNF564 | 0.690762 | 4 | 0 | 3 |
| MYCBP2 | COIL | 0.688524 | 3 | 0 | 3 |
| MYCBP2 | IQCH-AS1 | 0.686634 | 3 | 0 | 3 |
| MYCBP2 | A2ML1 | 0.673417 | 3 | 0 | 3 |
| MYCBP2 | VSIG10L | 0.669772 | 3 | 0 | 3 |
| MYCBP2 | ANKRD35 | 0.668297 | 4 | 0 | 4 |
| MYCBP2 | SPINK7 | 0.662966 | 3 | 0 | 3 |
| MYCBP2 | TMPRSS11B | 0.655943 | 3 | 0 | 3 |
| MYCBP2 | VCPIP1 | 0.652826 | 4 | 0 | 4 |
| MYCBP2 | SCEL | 0.649483 | 7 | 0 | 7 |
For details and further investigation, click here