| Full name: peptidylprolyl isomerase like 2 | Alias Symbol: UBOX7|CYC4|Cyp-60 | ||
| Type: protein-coding gene | Cytoband: 22q11.21 | ||
| Entrez ID: 23759 | HGNC ID: HGNC:9261 | Ensembl Gene: ENSG00000100023 | OMIM ID: 607588 |
Screen Evidence:
| |||
Expression of PPIL2:
| Dataset | Gene | EntrezID | Probe | Log2FC | Adj.pValue | Expression |
|---|---|---|---|---|---|---|
| GSE17351 | PPIL2 | 23759 | 209299_x_at | 0.0421 | 0.9390 | |
| GSE20347 | PPIL2 | 23759 | 206063_x_at | -0.0369 | 0.6886 | |
| GSE23400 | PPIL2 | 23759 | 214986_x_at | -0.0431 | 0.3248 | |
| GSE26886 | PPIL2 | 23759 | 217407_x_at | -0.1097 | 0.3192 | |
| GSE29001 | PPIL2 | 23759 | 217407_x_at | -0.1898 | 0.3584 | |
| GSE38129 | PPIL2 | 23759 | 206063_x_at | -0.0336 | 0.7347 | |
| GSE45670 | PPIL2 | 23759 | 206063_x_at | 0.1629 | 0.0866 | |
| GSE53622 | PPIL2 | 23759 | 20416 | -0.2795 | 0.0002 | |
| GSE53624 | PPIL2 | 23759 | 20416 | -0.0693 | 0.2679 | |
| GSE63941 | PPIL2 | 23759 | 206063_x_at | 0.1367 | 0.5014 | |
| GSE77861 | PPIL2 | 23759 | 206063_x_at | 0.0625 | 0.7630 | |
| GSE97050 | PPIL2 | 23759 | A_33_P3209396 | -0.0790 | 0.8190 | |
| SRP007169 | PPIL2 | 23759 | RNAseq | -0.5041 | 0.2423 | |
| SRP008496 | PPIL2 | 23759 | RNAseq | -0.5641 | 0.0507 | |
| SRP064894 | PPIL2 | 23759 | RNAseq | 0.2326 | 0.2543 | |
| SRP133303 | PPIL2 | 23759 | RNAseq | -0.1477 | 0.2252 | |
| SRP159526 | PPIL2 | 23759 | RNAseq | -0.2736 | 0.2066 | |
| SRP193095 | PPIL2 | 23759 | RNAseq | -0.0528 | 0.6464 | |
| SRP219564 | PPIL2 | 23759 | RNAseq | 0.4002 | 0.2361 | |
| TCGA | PPIL2 | 23759 | RNAseq | -0.0027 | 0.9555 |
Upregulated datasets: 0; Downregulated datasets: 0.
Survival by PPIL2 expression:
 | 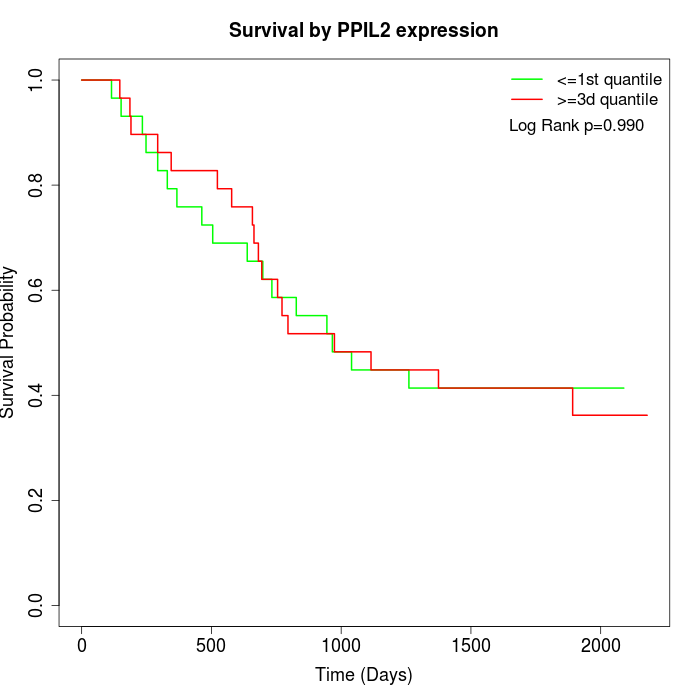 | 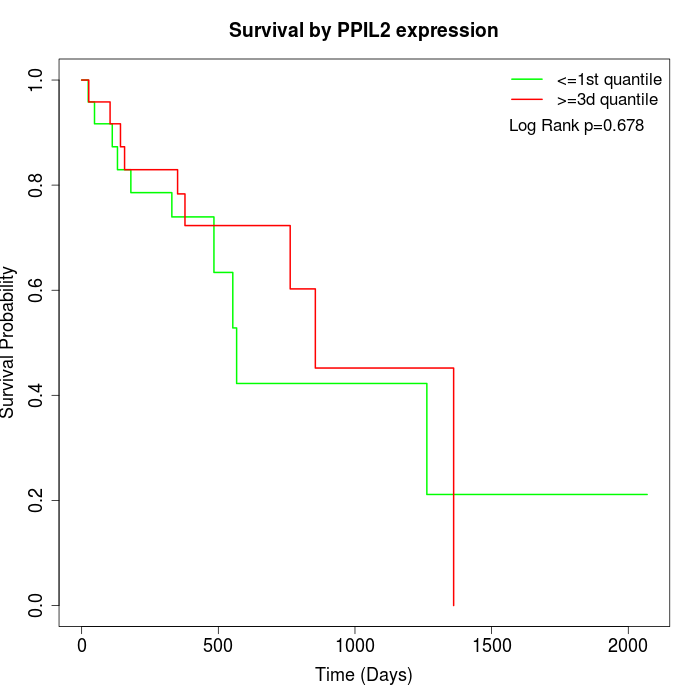 |
| GSE53622 | GSE53624 | TCGA |
Note: Click image to view full size file.
Copy number change of PPIL2:
| Dataset | Gene | EntrezID | Gain | Loss | Normal | Detail |
|---|---|---|---|---|---|---|
| GSE15526 | PPIL2 | 23759 | 5 | 7 | 18 | |
| GSE20123 | PPIL2 | 23759 | 5 | 7 | 18 | |
| GSE43470 | PPIL2 | 23759 | 3 | 7 | 33 | |
| GSE46452 | PPIL2 | 23759 | 33 | 1 | 25 | |
| GSE47630 | PPIL2 | 23759 | 8 | 5 | 27 | |
| GSE54993 | PPIL2 | 23759 | 3 | 6 | 61 | |
| GSE54994 | PPIL2 | 23759 | 11 | 7 | 35 | |
| GSE60625 | PPIL2 | 23759 | 5 | 0 | 6 | |
| GSE74703 | PPIL2 | 23759 | 3 | 5 | 28 | |
| GSE74704 | PPIL2 | 23759 | 2 | 4 | 14 | |
| TCGA | PPIL2 | 23759 | 27 | 17 | 52 |
Total number of gains: 105; Total number of losses: 66; Total Number of normals: 317.
Somatic mutations of PPIL2:
Generating mutation plots.
Highly correlated genes for PPIL2:
Showing top 20/270 corelated genes with mean PCC>0.5.
| Gene1 | Gene2 | Mean PCC | Num. Datasets | Num. PCC<0 | Num. PCC>0.5 |
|---|---|---|---|---|---|
| PPIL2 | LRFN2 | 0.751958 | 3 | 0 | 3 |
| PPIL2 | SLC10A1 | 0.747941 | 3 | 0 | 3 |
| PPIL2 | ZNF182 | 0.745524 | 3 | 0 | 3 |
| PPIL2 | ZNF777 | 0.74357 | 3 | 0 | 3 |
| PPIL2 | GNMT | 0.741497 | 3 | 0 | 3 |
| PPIL2 | TMUB1 | 0.739254 | 4 | 0 | 3 |
| PPIL2 | ZNF524 | 0.727418 | 4 | 0 | 3 |
| PPIL2 | GRIPAP1 | 0.724528 | 4 | 0 | 3 |
| PPIL2 | MIIP | 0.72406 | 3 | 0 | 3 |
| PPIL2 | MGAT5B | 0.716247 | 3 | 0 | 3 |
| PPIL2 | C19orf25 | 0.707552 | 4 | 0 | 3 |
| PPIL2 | TDRD1 | 0.702813 | 3 | 0 | 3 |
| PPIL2 | SNORA71A | 0.702588 | 3 | 0 | 3 |
| PPIL2 | ABCA4 | 0.698383 | 3 | 0 | 3 |
| PPIL2 | USHBP1 | 0.698156 | 3 | 0 | 3 |
| PPIL2 | SLC37A1 | 0.697647 | 3 | 0 | 3 |
| PPIL2 | SETD1B | 0.697579 | 5 | 0 | 4 |
| PPIL2 | CC2D1B | 0.69284 | 4 | 0 | 3 |
| PPIL2 | UMODL1 | 0.690027 | 3 | 0 | 3 |
| PPIL2 | ABCA2 | 0.685173 | 4 | 0 | 4 |
For details and further investigation, click here