| Full name: SET domain containing 1B, histone lysine methyltransferase | Alias Symbol: KIAA1076|Set1B|KMT2G | ||
| Type: protein-coding gene | Cytoband: 12q24.31 | ||
| Entrez ID: 23067 | HGNC ID: HGNC:29187 | Ensembl Gene: ENSG00000139718 | OMIM ID: 611055 |
Screen Evidence:
| |||
Expression of SETD1B:
| Dataset | Gene | EntrezID | Probe | Log2FC | Adj.pValue | Expression |
|---|---|---|---|---|---|---|
| GSE17351 | SETD1B | 23067 | 213153_at | 0.0257 | 0.9518 | |
| GSE20347 | SETD1B | 23067 | 213153_at | -0.0447 | 0.6902 | |
| GSE23400 | SETD1B | 23067 | 213153_at | -0.1735 | 0.0009 | |
| GSE26886 | SETD1B | 23067 | 213153_at | -0.1304 | 0.4742 | |
| GSE29001 | SETD1B | 23067 | 213153_at | -0.1483 | 0.3558 | |
| GSE38129 | SETD1B | 23067 | 213153_at | -0.1395 | 0.1009 | |
| GSE45670 | SETD1B | 23067 | 213153_at | -0.1318 | 0.1741 | |
| GSE53622 | SETD1B | 23067 | 61517 | -0.2809 | 0.0000 | |
| GSE53624 | SETD1B | 23067 | 61517 | -0.1241 | 0.0430 | |
| GSE63941 | SETD1B | 23067 | 213153_at | 0.0325 | 0.9271 | |
| GSE77861 | SETD1B | 23067 | 213153_at | 0.0848 | 0.5841 | |
| GSE97050 | SETD1B | A_19_P00809382 | -0.3615 | 0.1897 | ||
| SRP007169 | SETD1B | 23067 | RNAseq | -0.5456 | 0.3086 | |
| SRP008496 | SETD1B | 23067 | RNAseq | -0.4700 | 0.1190 | |
| SRP064894 | SETD1B | 23067 | RNAseq | -0.7140 | 0.0001 | |
| SRP133303 | SETD1B | 23067 | RNAseq | -0.3543 | 0.0052 | |
| SRP159526 | SETD1B | 23067 | RNAseq | -0.2447 | 0.2387 | |
| SRP193095 | SETD1B | 23067 | RNAseq | -0.0624 | 0.7200 | |
| SRP219564 | SETD1B | 23067 | RNAseq | -0.4214 | 0.3344 | |
| TCGA | SETD1B | 23067 | RNAseq | -0.0535 | 0.2313 |
Upregulated datasets: 0; Downregulated datasets: 0.
Survival by SETD1B expression:
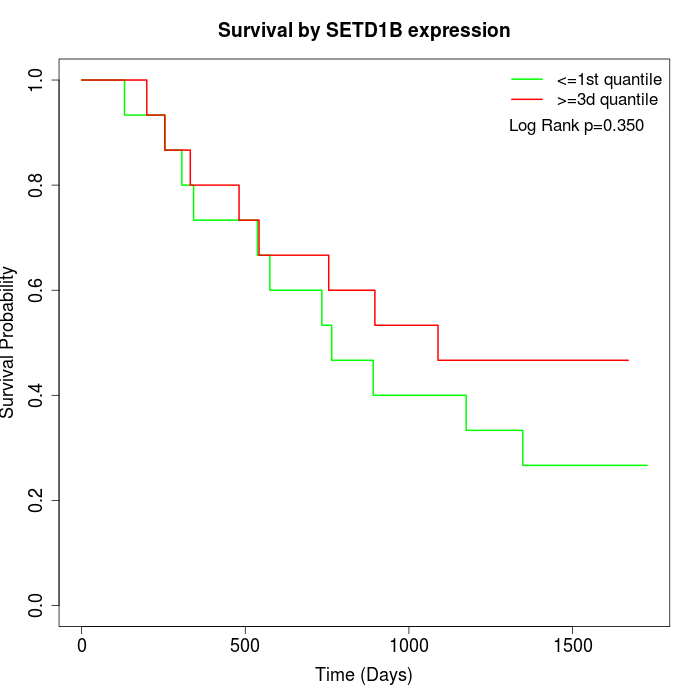 | 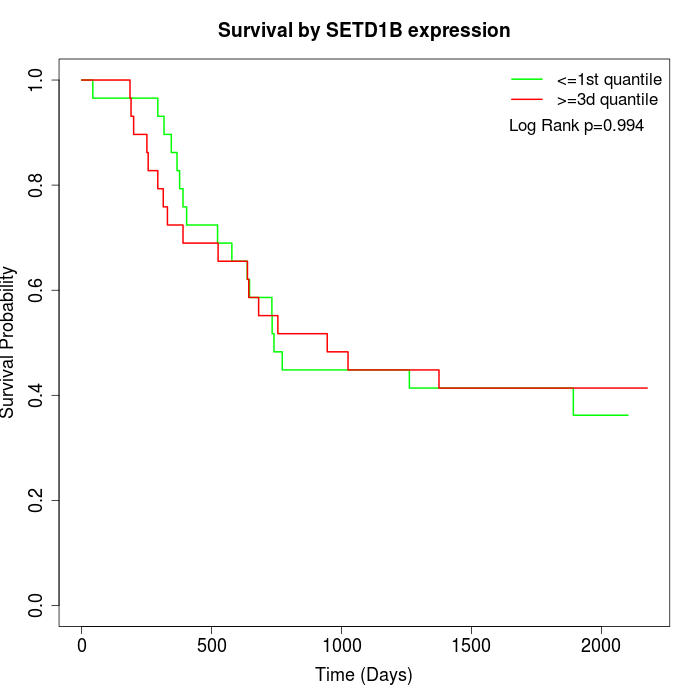 | 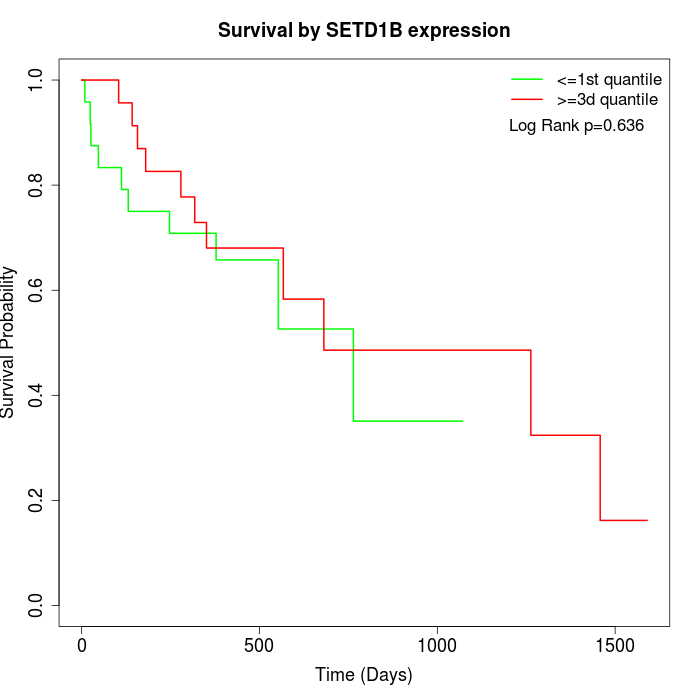 |
| GSE53622 | GSE53624 | TCGA |
Note: Click image to view full size file.
Copy number change of SETD1B:
| Dataset | Gene | EntrezID | Gain | Loss | Normal | Detail |
|---|---|---|---|---|---|---|
| GSE15526 | SETD1B | 23067 | 5 | 4 | 21 | |
| GSE20123 | SETD1B | 23067 | 5 | 4 | 21 | |
| GSE43470 | SETD1B | 23067 | 2 | 2 | 39 | |
| GSE46452 | SETD1B | 23067 | 9 | 1 | 49 | |
| GSE47630 | SETD1B | 23067 | 9 | 3 | 28 | |
| GSE54993 | SETD1B | 23067 | 0 | 5 | 65 | |
| GSE54994 | SETD1B | 23067 | 6 | 7 | 40 | |
| GSE60625 | SETD1B | 23067 | 0 | 0 | 11 | |
| GSE74703 | SETD1B | 23067 | 2 | 1 | 33 | |
| GSE74704 | SETD1B | 23067 | 4 | 2 | 14 | |
| TCGA | SETD1B | 23067 | 21 | 10 | 65 |
Total number of gains: 63; Total number of losses: 39; Total Number of normals: 386.
Somatic mutations of SETD1B:
Generating mutation plots.
Highly correlated genes for SETD1B:
Showing top 20/76 corelated genes with mean PCC>0.5.
| Gene1 | Gene2 | Mean PCC | Num. Datasets | Num. PCC<0 | Num. PCC>0.5 |
|---|---|---|---|---|---|
| SETD1B | POLL | 0.858 | 3 | 0 | 3 |
| SETD1B | ZNF428 | 0.767178 | 3 | 0 | 3 |
| SETD1B | ZKSCAN2 | 0.748679 | 3 | 0 | 3 |
| SETD1B | ZC3H10 | 0.74865 | 3 | 0 | 3 |
| SETD1B | TMUB1 | 0.730858 | 3 | 0 | 3 |
| SETD1B | PMPCA | 0.728586 | 3 | 0 | 3 |
| SETD1B | CLN3 | 0.702562 | 4 | 0 | 3 |
| SETD1B | PPIL2 | 0.697579 | 5 | 0 | 4 |
| SETD1B | GRIPAP1 | 0.680344 | 4 | 0 | 3 |
| SETD1B | DDX49 | 0.679697 | 3 | 0 | 3 |
| SETD1B | OR3A3 | 0.675139 | 3 | 0 | 3 |
| SETD1B | CEP104 | 0.674095 | 5 | 0 | 4 |
| SETD1B | DYRK1B | 0.673456 | 3 | 0 | 3 |
| SETD1B | FAAH | 0.671959 | 3 | 0 | 3 |
| SETD1B | WDR45 | 0.671119 | 4 | 0 | 3 |
| SETD1B | PARS2 | 0.667974 | 3 | 0 | 3 |
| SETD1B | CHP2 | 0.666792 | 3 | 0 | 3 |
| SETD1B | UCK1 | 0.662526 | 4 | 0 | 3 |
| SETD1B | ABCA7 | 0.65736 | 3 | 0 | 3 |
| SETD1B | RPRM | 0.656946 | 4 | 0 | 3 |
For details and further investigation, click here