| Full name: migration and invasion inhibitory protein | Alias Symbol: FLJ12438|IIp45 | ||
| Type: protein-coding gene | Cytoband: 1p36.22 | ||
| Entrez ID: 60672 | HGNC ID: HGNC:25715 | Ensembl Gene: ENSG00000116691 | OMIM ID: 608772 |
Expression of MIIP:
| Dataset | Gene | EntrezID | Probe | Log2FC | Adj.pValue | Expression |
|---|---|---|---|---|---|---|
| GSE17351 | MIIP | 60672 | 48659_at | 0.6280 | 0.2254 | |
| GSE20347 | MIIP | 60672 | 48659_at | 0.2171 | 0.0145 | |
| GSE23400 | MIIP | 60672 | 48659_at | 0.0504 | 0.2085 | |
| GSE26886 | MIIP | 60672 | 218551_at | 0.4717 | 0.0017 | |
| GSE29001 | MIIP | 60672 | 48659_at | 0.0924 | 0.5163 | |
| GSE38129 | MIIP | 60672 | 48659_at | 0.1422 | 0.0701 | |
| GSE45670 | MIIP | 60672 | 218551_at | 0.0339 | 0.7406 | |
| GSE63941 | MIIP | 60672 | 48659_at | 1.0170 | 0.0050 | |
| GSE77861 | MIIP | 60672 | 218551_at | 0.0097 | 0.9671 | |
| GSE97050 | MIIP | 60672 | A_33_P3256232 | 0.3468 | 0.1579 | |
| SRP007169 | MIIP | 60672 | RNAseq | 0.3392 | 0.6165 | |
| SRP064894 | MIIP | 60672 | RNAseq | 1.7557 | 0.0000 | |
| SRP133303 | MIIP | 60672 | RNAseq | 0.7115 | 0.0010 | |
| SRP159526 | MIIP | 60672 | RNAseq | 1.0087 | 0.0280 | |
| SRP193095 | MIIP | 60672 | RNAseq | 0.9689 | 0.0000 | |
| SRP219564 | MIIP | 60672 | RNAseq | 0.7695 | 0.0832 | |
| TCGA | MIIP | 60672 | RNAseq | 0.2813 | 0.0001 |
Upregulated datasets: 3; Downregulated datasets: 0.
Survival by MIIP expression:
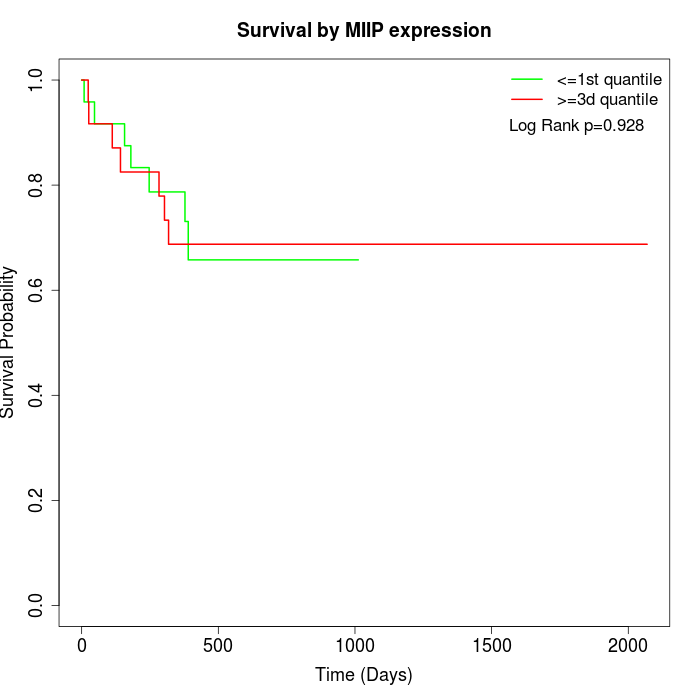 |
| TCGA |
Note: Click image to view full size file.
Copy number change of MIIP:
| Dataset | Gene | EntrezID | Gain | Loss | Normal | Detail |
|---|---|---|---|---|---|---|
| GSE15526 | MIIP | 60672 | 0 | 5 | 25 | |
| GSE20123 | MIIP | 60672 | 0 | 4 | 26 | |
| GSE43470 | MIIP | 60672 | 4 | 6 | 33 | |
| GSE46452 | MIIP | 60672 | 7 | 1 | 51 | |
| GSE47630 | MIIP | 60672 | 8 | 4 | 28 | |
| GSE54993 | MIIP | 60672 | 3 | 1 | 66 | |
| GSE54994 | MIIP | 60672 | 11 | 4 | 38 | |
| GSE60625 | MIIP | 60672 | 0 | 0 | 11 | |
| GSE74703 | MIIP | 60672 | 3 | 4 | 29 | |
| GSE74704 | MIIP | 60672 | 0 | 0 | 20 | |
| TCGA | MIIP | 60672 | 10 | 22 | 64 |
Total number of gains: 46; Total number of losses: 51; Total Number of normals: 391.
Somatic mutations of MIIP:
Generating mutation plots.
Highly correlated genes for MIIP:
Showing top 20/577 corelated genes with mean PCC>0.5.
| Gene1 | Gene2 | Mean PCC | Num. Datasets | Num. PCC<0 | Num. PCC>0.5 |
|---|---|---|---|---|---|
| MIIP | WDR83 | 0.868613 | 3 | 0 | 3 |
| MIIP | PARS2 | 0.816673 | 3 | 0 | 3 |
| MIIP | CC2D1B | 0.805618 | 3 | 0 | 3 |
| MIIP | GAS6-AS1 | 0.794865 | 3 | 0 | 3 |
| MIIP | RPP25 | 0.794226 | 5 | 0 | 5 |
| MIIP | ALKBH2 | 0.787611 | 3 | 0 | 3 |
| MIIP | UMODL1 | 0.780325 | 3 | 0 | 3 |
| MIIP | CEBPE | 0.779373 | 3 | 0 | 3 |
| MIIP | FAM24B | 0.77843 | 3 | 0 | 3 |
| MIIP | COL27A1 | 0.770419 | 3 | 0 | 3 |
| MIIP | NEUROG1 | 0.768615 | 3 | 0 | 3 |
| MIIP | BEND3 | 0.767212 | 3 | 0 | 3 |
| MIIP | DCPS | 0.761153 | 3 | 0 | 3 |
| MIIP | USHBP1 | 0.758187 | 3 | 0 | 3 |
| MIIP | DNAJB8 | 0.75421 | 3 | 0 | 3 |
| MIIP | C7orf26 | 0.748484 | 3 | 0 | 3 |
| MIIP | TMEM179 | 0.748206 | 3 | 0 | 3 |
| MIIP | YDJC | 0.746379 | 3 | 0 | 3 |
| MIIP | C7orf61 | 0.745909 | 3 | 0 | 3 |
| MIIP | TM6SF2 | 0.745408 | 3 | 0 | 3 |
For details and further investigation, click here