| Full name: translocator protein 2 | Alias Symbol: dJ34B21.2 | ||
| Type: protein-coding gene | Cytoband: 6p21.1 | ||
| Entrez ID: 222642 | HGNC ID: HGNC:21256 | Ensembl Gene: ENSG00000112212 | OMIM ID: |
Expression of TSPO2:
| Dataset | Gene | EntrezID | Probe | Log2FC | Adj.pValue | Expression |
|---|---|---|---|---|---|---|
| GSE17351 | TSPO2 | 222642 | 215449_at | -0.0365 | 0.9073 | |
| GSE20347 | TSPO2 | 222642 | 215449_at | -0.1127 | 0.2938 | |
| GSE23400 | TSPO2 | 222642 | 215449_at | -0.1666 | 0.0004 | |
| GSE26886 | TSPO2 | 222642 | 215449_at | -0.2328 | 0.1081 | |
| GSE29001 | TSPO2 | 222642 | 215449_at | -0.2792 | 0.0734 | |
| GSE38129 | TSPO2 | 222642 | 215449_at | -0.1413 | 0.0915 | |
| GSE45670 | TSPO2 | 222642 | 215449_at | 0.0661 | 0.6298 | |
| GSE53622 | TSPO2 | 222642 | 108391 | 2.3537 | 0.0000 | |
| GSE53624 | TSPO2 | 222642 | 108391 | 1.9837 | 0.0000 | |
| GSE63941 | TSPO2 | 222642 | 215449_at | 0.0615 | 0.6842 | |
| GSE77861 | TSPO2 | 222642 | 215449_at | -0.0298 | 0.8209 | |
| GSE97050 | TSPO2 | 222642 | A_33_P3234222 | 1.3007 | 0.0631 | |
| TCGA | TSPO2 | 222642 | RNAseq | -2.2785 | 0.0000 |
Upregulated datasets: 2; Downregulated datasets: 1.
Survival by TSPO2 expression:
 | 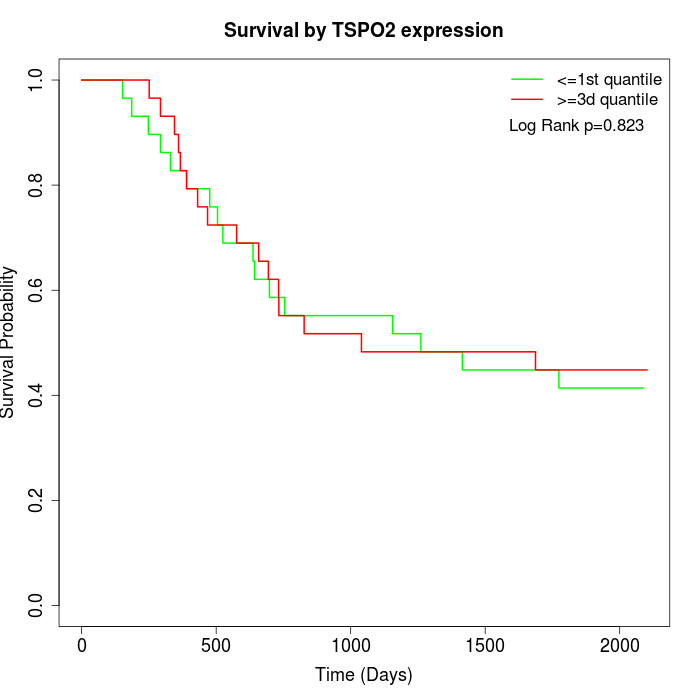 | 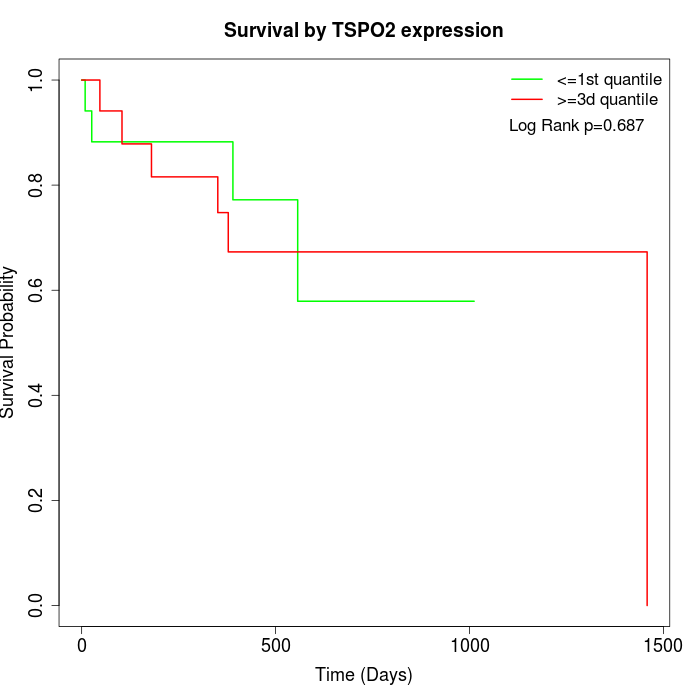 |
| GSE53622 | GSE53624 | TCGA |
Note: Click image to view full size file.
Copy number change of TSPO2:
| Dataset | Gene | EntrezID | Gain | Loss | Normal | Detail |
|---|---|---|---|---|---|---|
| GSE15526 | TSPO2 | 222642 | 3 | 3 | 24 | |
| GSE20123 | TSPO2 | 222642 | 3 | 3 | 24 | |
| GSE43470 | TSPO2 | 222642 | 6 | 0 | 37 | |
| GSE46452 | TSPO2 | 222642 | 2 | 9 | 48 | |
| GSE47630 | TSPO2 | 222642 | 8 | 4 | 28 | |
| GSE54993 | TSPO2 | 222642 | 3 | 2 | 65 | |
| GSE54994 | TSPO2 | 222642 | 11 | 4 | 38 | |
| GSE60625 | TSPO2 | 222642 | 0 | 1 | 10 | |
| GSE74703 | TSPO2 | 222642 | 6 | 0 | 30 | |
| GSE74704 | TSPO2 | 222642 | 1 | 3 | 16 | |
| TCGA | TSPO2 | 222642 | 19 | 13 | 64 |
Total number of gains: 62; Total number of losses: 42; Total Number of normals: 384.
Somatic mutations of TSPO2:
Generating mutation plots.
Highly correlated genes for TSPO2:
Showing top 20/954 corelated genes with mean PCC>0.5.
| Gene1 | Gene2 | Mean PCC | Num. Datasets | Num. PCC<0 | Num. PCC>0.5 |
|---|---|---|---|---|---|
| TSPO2 | C1QTNF6 | 0.873272 | 3 | 0 | 3 |
| TSPO2 | CHPF2 | 0.806633 | 3 | 0 | 3 |
| TSPO2 | IL15RA | 0.780146 | 3 | 0 | 3 |
| TSPO2 | HAGHL | 0.761441 | 4 | 0 | 4 |
| TSPO2 | RFX8 | 0.75237 | 3 | 0 | 3 |
| TSPO2 | FMNL1 | 0.752328 | 3 | 0 | 3 |
| TSPO2 | OPRD1 | 0.741862 | 3 | 0 | 3 |
| TSPO2 | P4HA2 | 0.74117 | 3 | 0 | 3 |
| TSPO2 | MS4A18 | 0.736461 | 3 | 0 | 3 |
| TSPO2 | BEAN1 | 0.733568 | 3 | 0 | 3 |
| TSPO2 | SLC22A14 | 0.722749 | 9 | 0 | 8 |
| TSPO2 | RAB33A | 0.710939 | 3 | 0 | 3 |
| TSPO2 | MZB1 | 0.707715 | 3 | 0 | 3 |
| TSPO2 | BOP1 | 0.70441 | 3 | 0 | 3 |
| TSPO2 | ATAD3C | 0.703773 | 3 | 0 | 3 |
| TSPO2 | ANHX | 0.702893 | 4 | 0 | 4 |
| TSPO2 | ACR | 0.701129 | 7 | 0 | 7 |
| TSPO2 | FSTL4 | 0.700974 | 5 | 0 | 5 |
| TSPO2 | CXCR6 | 0.700715 | 3 | 0 | 3 |
| TSPO2 | SPX | 0.697394 | 4 | 0 | 3 |
For details and further investigation, click here