| Full name: centrosomal protein 95 | Alias Symbol: DKFZp667E1824 | ||
| Type: protein-coding gene | Cytoband: 17q23.3 | ||
| Entrez ID: 90799 | HGNC ID: HGNC:25141 | Ensembl Gene: ENSG00000258890 | OMIM ID: |
Expression of CEP95:
| Dataset | Gene | EntrezID | Probe | Log2FC | Adj.pValue | Expression |
|---|---|---|---|---|---|---|
| GSE17351 | CEP95 | 90799 | 225705_at | -0.1773 | 0.5217 | |
| GSE26886 | CEP95 | 90799 | 225705_at | 0.7745 | 0.0058 | |
| GSE45670 | CEP95 | 90799 | 225705_at | -0.0523 | 0.7824 | |
| GSE53622 | CEP95 | 90799 | 103409 | 0.3081 | 0.0000 | |
| GSE53624 | CEP95 | 90799 | 60093 | 0.2524 | 0.0000 | |
| GSE63941 | CEP95 | 90799 | 225705_at | 0.8327 | 0.1415 | |
| GSE77861 | CEP95 | 90799 | 225705_at | 0.6806 | 0.0078 | |
| GSE97050 | CEP95 | 90799 | A_23_P307400 | -0.2553 | 0.3457 | |
| SRP007169 | CEP95 | 90799 | RNAseq | 0.3604 | 0.3988 | |
| SRP008496 | CEP95 | 90799 | RNAseq | 0.4365 | 0.1581 | |
| SRP064894 | CEP95 | 90799 | RNAseq | 0.1680 | 0.2903 | |
| SRP133303 | CEP95 | 90799 | RNAseq | 0.3246 | 0.0774 | |
| SRP159526 | CEP95 | 90799 | RNAseq | 0.5099 | 0.2468 | |
| SRP193095 | CEP95 | 90799 | RNAseq | 0.1173 | 0.1677 | |
| SRP219564 | CEP95 | 90799 | RNAseq | 0.2249 | 0.6222 |
Upregulated datasets: 0; Downregulated datasets: 0.
Survival by CEP95 expression:
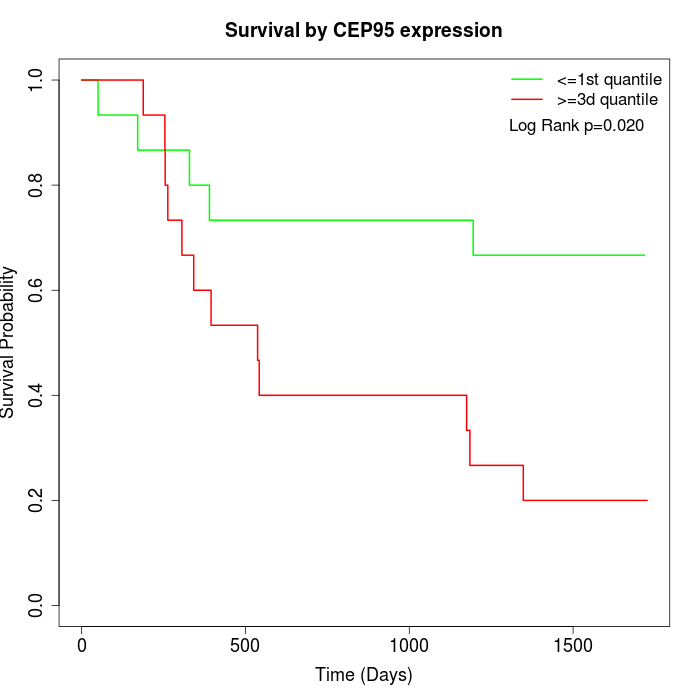 | 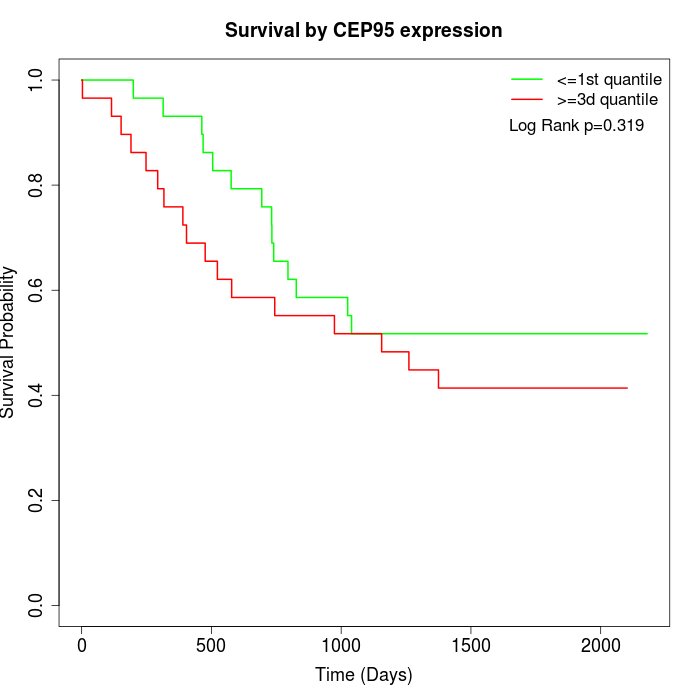 |
| GSE53622 | GSE53624 |
Note: Click image to view full size file.
Copy number change of CEP95:
| Dataset | Gene | EntrezID | Gain | Loss | Normal | Detail |
|---|---|---|---|---|---|---|
| GSE15526 | CEP95 | 90799 | 3 | 1 | 26 | |
| GSE20123 | CEP95 | 90799 | 3 | 1 | 26 | |
| GSE43470 | CEP95 | 90799 | 5 | 0 | 38 | |
| GSE46452 | CEP95 | 90799 | 32 | 0 | 27 | |
| GSE47630 | CEP95 | 90799 | 7 | 1 | 32 | |
| GSE54993 | CEP95 | 90799 | 2 | 5 | 63 | |
| GSE54994 | CEP95 | 90799 | 9 | 4 | 40 | |
| GSE60625 | CEP95 | 90799 | 4 | 0 | 7 | |
| GSE74703 | CEP95 | 90799 | 5 | 0 | 31 | |
| GSE74704 | CEP95 | 90799 | 3 | 1 | 16 | |
| TCGA | CEP95 | 90799 | 30 | 8 | 58 |
Total number of gains: 103; Total number of losses: 21; Total Number of normals: 364.
Somatic mutations of CEP95:
Generating mutation plots.
Highly correlated genes for CEP95:
Showing top 20/535 corelated genes with mean PCC>0.5.
| Gene1 | Gene2 | Mean PCC | Num. Datasets | Num. PCC<0 | Num. PCC>0.5 |
|---|---|---|---|---|---|
| CEP95 | SLC41A1 | 0.797075 | 3 | 0 | 3 |
| CEP95 | SRSF6 | 0.776028 | 3 | 0 | 3 |
| CEP95 | SLC38A1 | 0.769669 | 3 | 0 | 3 |
| CEP95 | RBMX2 | 0.76785 | 3 | 0 | 3 |
| CEP95 | GOLIM4 | 0.765205 | 3 | 0 | 3 |
| CEP95 | TRAF3IP1 | 0.761457 | 3 | 0 | 3 |
| CEP95 | RRP15 | 0.761251 | 3 | 0 | 3 |
| CEP95 | KDM5A | 0.757894 | 3 | 0 | 3 |
| CEP95 | PET117 | 0.754626 | 3 | 0 | 3 |
| CEP95 | TRMT6 | 0.754194 | 3 | 0 | 3 |
| CEP95 | SLC25A32 | 0.74855 | 3 | 0 | 3 |
| CEP95 | CHST15 | 0.745469 | 3 | 0 | 3 |
| CEP95 | ARPP19 | 0.735243 | 3 | 0 | 3 |
| CEP95 | VPS45 | 0.732796 | 3 | 0 | 3 |
| CEP95 | WDR81 | 0.732616 | 3 | 0 | 3 |
| CEP95 | SMARCA5 | 0.730681 | 3 | 0 | 3 |
| CEP95 | NOL9 | 0.730625 | 3 | 0 | 3 |
| CEP95 | GOSR1 | 0.729878 | 4 | 0 | 4 |
| CEP95 | TMTC1 | 0.728792 | 3 | 0 | 3 |
| CEP95 | CWC22 | 0.726055 | 3 | 0 | 3 |
For details and further investigation, click here