| Full name: cancer/testis antigen 62 | Alias Symbol: | ||
| Type: protein-coding gene | Cytoband: 15q23 | ||
| Entrez ID: 196993 | HGNC ID: HGNC:27286 | Ensembl Gene: ENSG00000225362 | OMIM ID: |
Expression of CT62:
| Dataset | Gene | EntrezID | Probe | Log2FC | Adj.pValue | Expression |
|---|---|---|---|---|---|---|
| GSE17351 | CT62 | 196993 | 214418_at | -0.0791 | 0.7496 | |
| GSE20347 | CT62 | 196993 | 214418_at | -0.0095 | 0.8891 | |
| GSE23400 | CT62 | 196993 | 214418_at | -0.0846 | 0.0003 | |
| GSE26886 | CT62 | 196993 | 214418_at | 0.0599 | 0.6981 | |
| GSE29001 | CT62 | 196993 | 214418_at | -0.0903 | 0.5913 | |
| GSE38129 | CT62 | 196993 | 214418_at | -0.0226 | 0.8077 | |
| GSE45670 | CT62 | 196993 | 214418_at | 0.0869 | 0.3714 | |
| GSE53622 | CT62 | 196993 | 61692 | 0.5264 | 0.0000 | |
| GSE53624 | CT62 | 196993 | 61692 | 0.6471 | 0.0000 | |
| GSE63941 | CT62 | 196993 | 214418_at | 0.1831 | 0.2521 | |
| GSE77861 | CT62 | 196993 | 214418_at | -0.0563 | 0.5777 | |
| GSE97050 | CT62 | 196993 | A_33_P3247165 | -0.0025 | 0.9927 | |
| TCGA | CT62 | 196993 | RNAseq | -1.9280 | 0.0165 |
Upregulated datasets: 0; Downregulated datasets: 1.
Survival by CT62 expression:
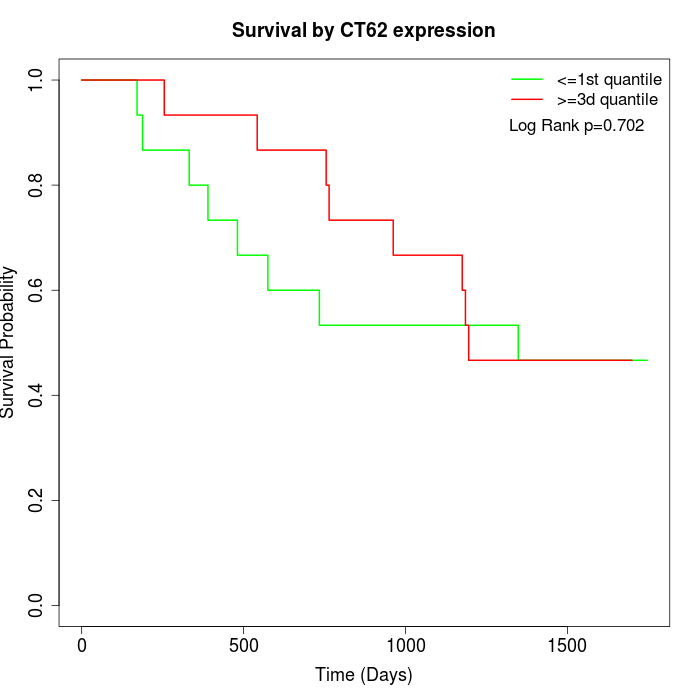 | 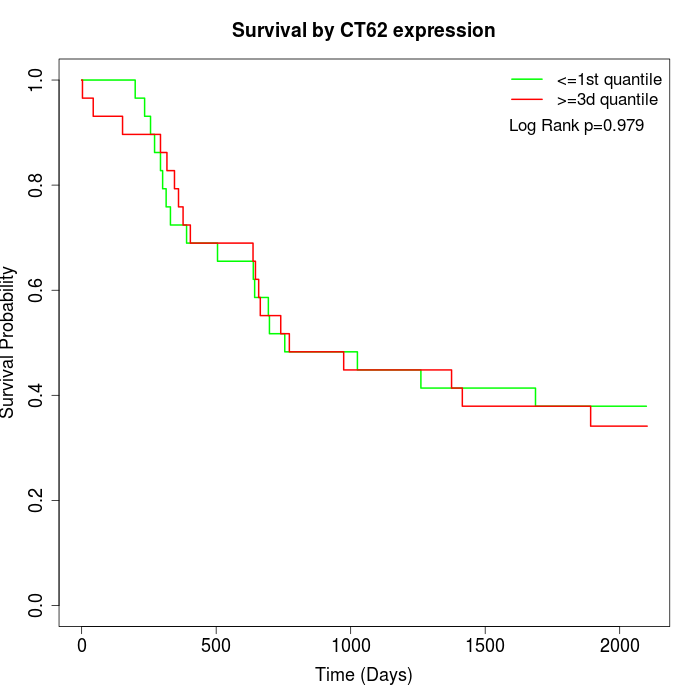 | 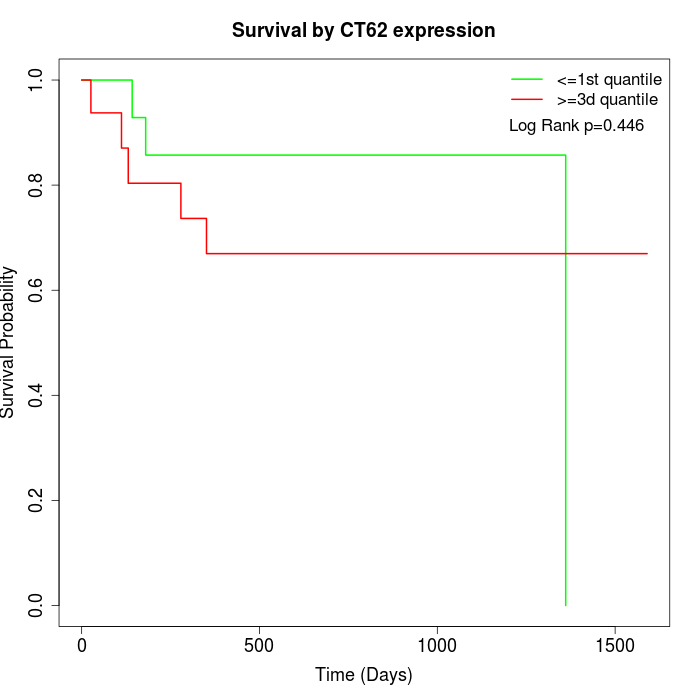 |
| GSE53622 | GSE53624 | TCGA |
Note: Click image to view full size file.
Copy number change of CT62:
| Dataset | Gene | EntrezID | Gain | Loss | Normal | Detail |
|---|---|---|---|---|---|---|
| GSE15526 | CT62 | 196993 | 7 | 1 | 22 | |
| GSE20123 | CT62 | 196993 | 7 | 1 | 22 | |
| GSE43470 | CT62 | 196993 | 4 | 6 | 33 | |
| GSE46452 | CT62 | 196993 | 3 | 7 | 49 | |
| GSE47630 | CT62 | 196993 | 8 | 10 | 22 | |
| GSE54993 | CT62 | 196993 | 5 | 6 | 59 | |
| GSE54994 | CT62 | 196993 | 6 | 8 | 39 | |
| GSE60625 | CT62 | 196993 | 4 | 4 | 3 | |
| GSE74703 | CT62 | 196993 | 4 | 3 | 29 | |
| GSE74704 | CT62 | 196993 | 3 | 1 | 16 | |
| TCGA | CT62 | 196993 | 10 | 15 | 71 |
Total number of gains: 61; Total number of losses: 62; Total Number of normals: 365.
Somatic mutations of CT62:
Generating mutation plots.
Highly correlated genes for CT62:
Showing top 20/422 corelated genes with mean PCC>0.5.
| Gene1 | Gene2 | Mean PCC | Num. Datasets | Num. PCC<0 | Num. PCC>0.5 |
|---|---|---|---|---|---|
| CT62 | RASL10B | 0.71623 | 5 | 0 | 5 |
| CT62 | MRPS16 | 0.680584 | 3 | 0 | 3 |
| CT62 | ARMCX4 | 0.679609 | 4 | 0 | 4 |
| CT62 | DAOA | 0.678699 | 3 | 0 | 3 |
| CT62 | NUTM1 | 0.675757 | 3 | 0 | 3 |
| CT62 | RBBP8NL | 0.675571 | 3 | 0 | 3 |
| CT62 | ST8SIA3 | 0.668751 | 4 | 0 | 3 |
| CT62 | BFSP2-AS1 | 0.66419 | 3 | 0 | 3 |
| CT62 | GPR182 | 0.659113 | 5 | 0 | 5 |
| CT62 | TREH | 0.656434 | 3 | 0 | 3 |
| CT62 | NRG1 | 0.656063 | 4 | 0 | 3 |
| CT62 | OR1J4 | 0.65107 | 4 | 0 | 4 |
| CT62 | PRM2 | 0.650212 | 3 | 0 | 3 |
| CT62 | OR2M5 | 0.649627 | 3 | 0 | 3 |
| CT62 | AMN | 0.644267 | 6 | 0 | 5 |
| CT62 | TBC1D10B | 0.641724 | 3 | 0 | 3 |
| CT62 | FSHB | 0.640556 | 4 | 0 | 3 |
| CT62 | CHGA | 0.639761 | 3 | 0 | 3 |
| CT62 | PNMA3 | 0.634975 | 8 | 0 | 6 |
| CT62 | PML | 0.632442 | 3 | 0 | 3 |
For details and further investigation, click here