| Full name: endogenous Bornavirus like nucleoprotein 2 | Alias Symbol: | ||
| Type: protein-coding gene | Cytoband: 3p13 | ||
| Entrez ID: 55096 | HGNC ID: HGNC:25493 | Ensembl Gene: ENSG00000255423 | OMIM ID: 613250 |
Expression of EBLN2:
| Dataset | Gene | EntrezID | Probe | Log2FC | Adj.pValue | Expression |
|---|---|---|---|---|---|---|
| GSE17351 | EBLN2 | 55096 | 219906_at | 0.1243 | 0.8094 | |
| GSE20347 | EBLN2 | 55096 | 219906_at | -0.0575 | 0.7655 | |
| GSE23400 | EBLN2 | 55096 | 219906_at | -0.1703 | 0.0002 | |
| GSE26886 | EBLN2 | 55096 | 219906_at | -0.1494 | 0.5594 | |
| GSE29001 | EBLN2 | 55096 | 219906_at | -0.5209 | 0.1609 | |
| GSE38129 | EBLN2 | 55096 | 219906_at | -0.1734 | 0.2979 | |
| GSE45670 | EBLN2 | 55096 | 219906_at | -0.2292 | 0.0623 | |
| GSE53622 | EBLN2 | 55096 | 34607 | 0.3635 | 0.0000 | |
| GSE53624 | EBLN2 | 55096 | 34607 | 0.0944 | 0.3069 | |
| GSE63941 | EBLN2 | 55096 | 219906_at | -0.7665 | 0.0160 | |
| GSE77861 | EBLN2 | 55096 | 219906_at | 0.1779 | 0.4217 | |
| GSE97050 | EBLN2 | 55096 | A_23_P6561 | 0.1217 | 0.5401 | |
| SRP133303 | EBLN2 | 55096 | RNAseq | -0.0006 | 0.9967 | |
| SRP159526 | EBLN2 | 55096 | RNAseq | -0.7314 | 0.0315 | |
| SRP193095 | EBLN2 | 55096 | RNAseq | -0.3009 | 0.0107 |
Upregulated datasets: 0; Downregulated datasets: 0.
Survival by EBLN2 expression:
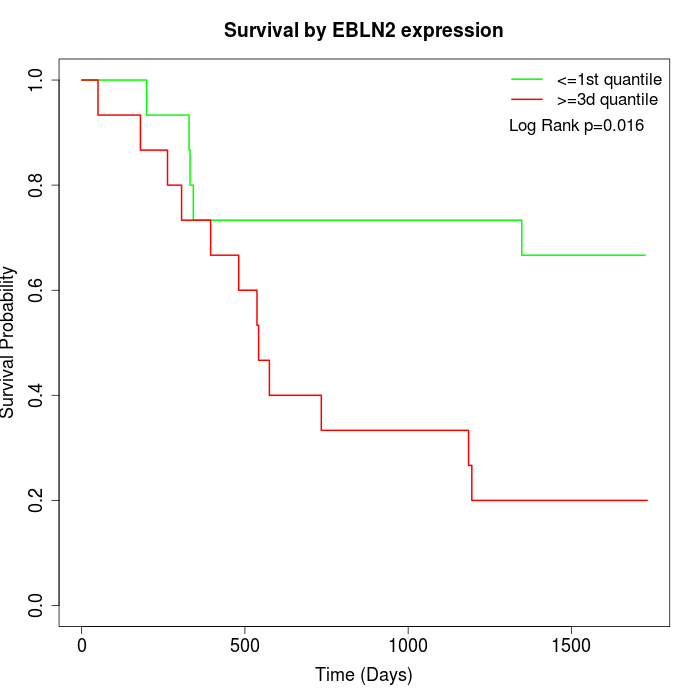 | 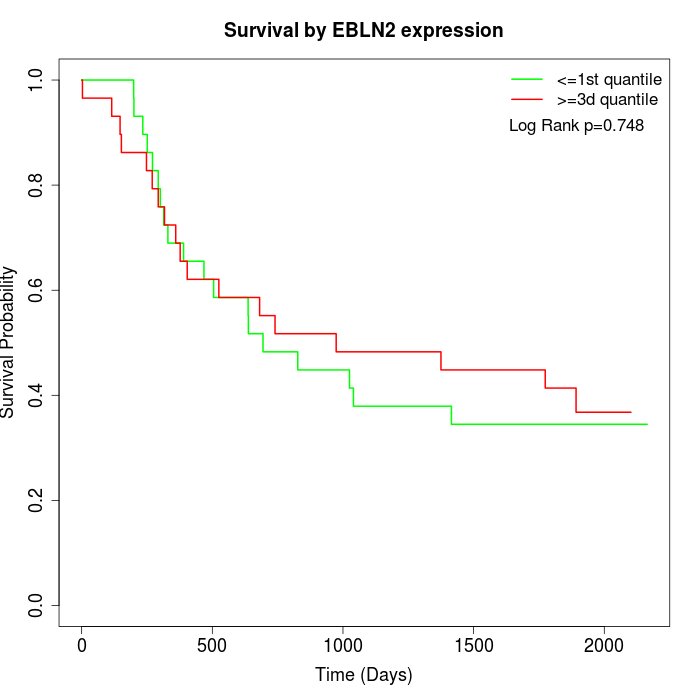 |
| GSE53622 | GSE53624 |
Note: Click image to view full size file.
Copy number change of EBLN2:
| Dataset | Gene | EntrezID | Gain | Loss | Normal | Detail |
|---|---|---|---|---|---|---|
| GSE15526 | EBLN2 | 55096 | 1 | 20 | 9 | |
| GSE20123 | EBLN2 | 55096 | 1 | 20 | 9 | |
| GSE43470 | EBLN2 | 55096 | 0 | 21 | 22 | |
| GSE46452 | EBLN2 | 55096 | 2 | 17 | 40 | |
| GSE47630 | EBLN2 | 55096 | 1 | 23 | 16 | |
| GSE54993 | EBLN2 | 55096 | 4 | 3 | 63 | |
| GSE54994 | EBLN2 | 55096 | 1 | 31 | 21 | |
| GSE60625 | EBLN2 | 55096 | 3 | 1 | 7 | |
| GSE74703 | EBLN2 | 55096 | 0 | 17 | 19 | |
| GSE74704 | EBLN2 | 55096 | 1 | 13 | 6 | |
| TCGA | EBLN2 | 55096 | 1 | 79 | 16 |
Total number of gains: 15; Total number of losses: 245; Total Number of normals: 228.
Somatic mutations of EBLN2:
Generating mutation plots.
Highly correlated genes for EBLN2:
Showing top 20/94 corelated genes with mean PCC>0.5.
| Gene1 | Gene2 | Mean PCC | Num. Datasets | Num. PCC<0 | Num. PCC>0.5 |
|---|---|---|---|---|---|
| EBLN2 | TMEM212 | 0.722117 | 3 | 0 | 3 |
| EBLN2 | DST | 0.670965 | 3 | 0 | 3 |
| EBLN2 | SLC35E1 | 0.659486 | 5 | 0 | 4 |
| EBLN2 | CCZ1B | 0.657916 | 5 | 0 | 4 |
| EBLN2 | PGF | 0.655836 | 6 | 0 | 5 |
| EBLN2 | DCLRE1C | 0.644615 | 6 | 0 | 5 |
| EBLN2 | RGPD6 | 0.643904 | 3 | 0 | 3 |
| EBLN2 | BPTF | 0.640285 | 3 | 0 | 3 |
| EBLN2 | WAC-AS1 | 0.637835 | 3 | 0 | 3 |
| EBLN2 | UVSSA | 0.637037 | 4 | 0 | 3 |
| EBLN2 | ANO7 | 0.635906 | 3 | 0 | 3 |
| EBLN2 | ZNF611 | 0.635683 | 6 | 0 | 5 |
| EBLN2 | LINC00662 | 0.633739 | 3 | 0 | 3 |
| EBLN2 | MSANTD2 | 0.632944 | 6 | 0 | 6 |
| EBLN2 | SSBP3-AS1 | 0.630694 | 5 | 0 | 4 |
| EBLN2 | LINC00893 | 0.628395 | 3 | 0 | 3 |
| EBLN2 | ADAM33 | 0.627971 | 3 | 0 | 3 |
| EBLN2 | AGAP9 | 0.627848 | 3 | 0 | 3 |
| EBLN2 | ANKRD10-IT1 | 0.625723 | 6 | 0 | 5 |
| EBLN2 | SLC26A6 | 0.623775 | 4 | 0 | 3 |
For details and further investigation, click here