| Full name: fms related tyrosine kinase 3 | Alias Symbol: STK1|FLK2|CD135 | ||
| Type: protein-coding gene | Cytoband: 13q12.2 | ||
| Entrez ID: 2322 | HGNC ID: HGNC:3765 | Ensembl Gene: ENSG00000122025 | OMIM ID: 136351 |
| Related drugs: 4SC-203, AKN-028, ALTIRATINIB, AMUVATINIB, ARSENIC TRIOXIDE, AS-602868, AST-487, AT-9283, AZACITIDINE, BMS-690514... [more] | |||
Screen Evidence:
| |||
FLT3 involved pathways:
| KEGG pathway | Description | View |
|---|---|---|
| hsa05200 | Pathways in cancer | |
| hsa05221 | Acute myeloid leukemia |
Expression of FLT3:
| Dataset | Gene | EntrezID | Probe | Log2FC | Adj.pValue | Expression |
|---|---|---|---|---|---|---|
| GSE17351 | FLT3 | 2322 | 206674_at | -0.2599 | 0.6610 | |
| GSE20347 | FLT3 | 2322 | 206674_at | -0.0924 | 0.2327 | |
| GSE23400 | FLT3 | 2322 | 206674_at | -0.1185 | 0.0000 | |
| GSE26886 | FLT3 | 2322 | 206674_at | -0.1576 | 0.2490 | |
| GSE29001 | FLT3 | 2322 | 206674_at | -0.2573 | 0.1241 | |
| GSE38129 | FLT3 | 2322 | 206674_at | -0.2612 | 0.0006 | |
| GSE45670 | FLT3 | 2322 | 206674_at | -0.1513 | 0.1628 | |
| GSE53622 | FLT3 | 2322 | 44701 | -0.7021 | 0.0000 | |
| GSE53624 | FLT3 | 2322 | 44701 | -1.0842 | 0.0000 | |
| GSE63941 | FLT3 | 2322 | 206674_at | 0.2664 | 0.3111 | |
| GSE77861 | FLT3 | 2322 | 206674_at | -0.2733 | 0.0640 | |
| SRP133303 | FLT3 | 2322 | RNAseq | -1.4703 | 0.0000 | |
| SRP159526 | FLT3 | 2322 | RNAseq | -1.0632 | 0.2434 | |
| SRP193095 | FLT3 | 2322 | RNAseq | -0.8950 | 0.0004 | |
| SRP219564 | FLT3 | 2322 | RNAseq | -1.3543 | 0.0652 | |
| TCGA | FLT3 | 2322 | RNAseq | -0.7562 | 0.1707 |
Upregulated datasets: 0; Downregulated datasets: 2.
Survival by FLT3 expression:
 | 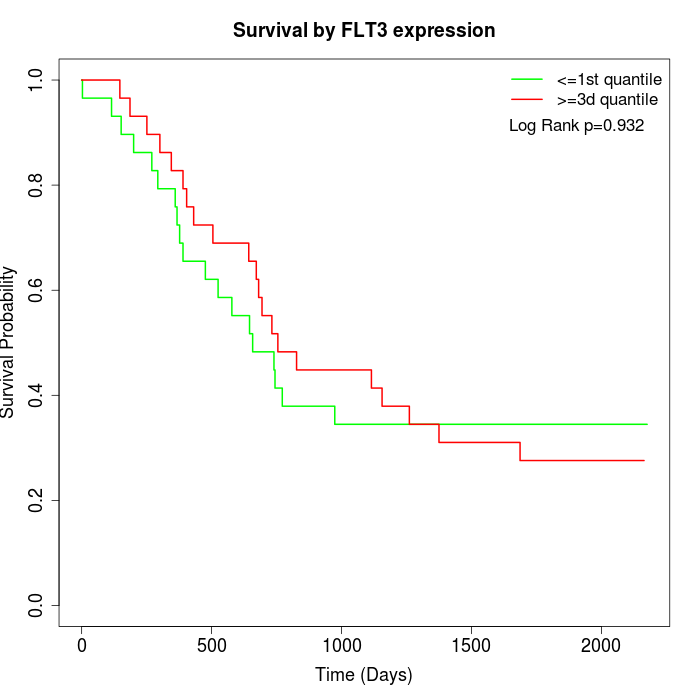 | 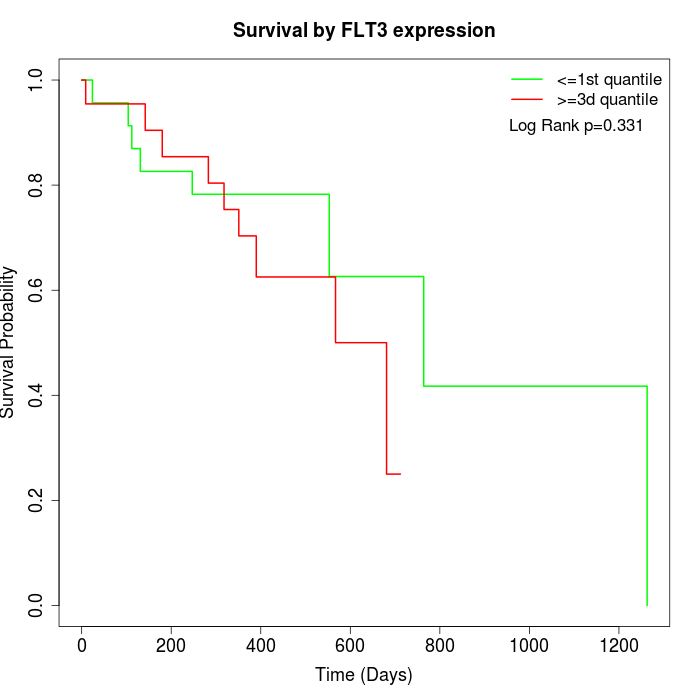 |
| GSE53622 | GSE53624 | TCGA |
Note: Click image to view full size file.
Copy number change of FLT3:
| Dataset | Gene | EntrezID | Gain | Loss | Normal | Detail |
|---|---|---|---|---|---|---|
| GSE15526 | FLT3 | 2322 | 1 | 14 | 15 | |
| GSE20123 | FLT3 | 2322 | 1 | 12 | 17 | |
| GSE43470 | FLT3 | 2322 | 2 | 12 | 29 | |
| GSE46452 | FLT3 | 2322 | 0 | 33 | 26 | |
| GSE47630 | FLT3 | 2322 | 3 | 26 | 11 | |
| GSE54993 | FLT3 | 2322 | 11 | 2 | 57 | |
| GSE54994 | FLT3 | 2322 | 1 | 13 | 39 | |
| GSE60625 | FLT3 | 2322 | 0 | 3 | 8 | |
| GSE74703 | FLT3 | 2322 | 2 | 9 | 25 | |
| GSE74704 | FLT3 | 2322 | 0 | 10 | 10 | |
| TCGA | FLT3 | 2322 | 7 | 39 | 50 |
Total number of gains: 28; Total number of losses: 173; Total Number of normals: 287.
Somatic mutations of FLT3:
Generating mutation plots.
Highly correlated genes for FLT3:
Showing top 20/321 corelated genes with mean PCC>0.5.
| Gene1 | Gene2 | Mean PCC | Num. Datasets | Num. PCC<0 | Num. PCC>0.5 |
|---|---|---|---|---|---|
| FLT3 | IFNA8 | 0.686918 | 3 | 0 | 3 |
| FLT3 | GREB1L | 0.665389 | 3 | 0 | 3 |
| FLT3 | CAV3 | 0.644749 | 4 | 0 | 3 |
| FLT3 | C16orf54 | 0.643677 | 4 | 0 | 4 |
| FLT3 | GPR183 | 0.642709 | 3 | 0 | 3 |
| FLT3 | FMO3 | 0.635957 | 4 | 0 | 3 |
| FLT3 | IFNA4 | 0.635663 | 3 | 0 | 3 |
| FLT3 | NPAP1 | 0.632608 | 3 | 0 | 3 |
| FLT3 | SLIT3 | 0.631305 | 4 | 0 | 4 |
| FLT3 | IL9R | 0.630801 | 4 | 0 | 4 |
| FLT3 | MAGI1-IT1 | 0.629149 | 3 | 0 | 3 |
| FLT3 | NKAIN1 | 0.627222 | 3 | 0 | 3 |
| FLT3 | G6PC | 0.625428 | 4 | 0 | 3 |
| FLT3 | BMP15 | 0.625199 | 4 | 0 | 4 |
| FLT3 | IFNW1 | 0.624476 | 3 | 0 | 3 |
| FLT3 | FLI1 | 0.623622 | 7 | 0 | 6 |
| FLT3 | LINC00892 | 0.622443 | 4 | 0 | 4 |
| FLT3 | EPN2-AS1 | 0.61885 | 3 | 0 | 3 |
| FLT3 | IFNA16 | 0.618323 | 3 | 0 | 3 |
| FLT3 | CFP | 0.617004 | 9 | 0 | 6 |
For details and further investigation, click here