| Full name: Fli-1 proto-oncogene, ETS transcription factor | Alias Symbol: SIC-1|EWSR2 | ||
| Type: protein-coding gene | Cytoband: 11q24.3 | ||
| Entrez ID: 2313 | HGNC ID: HGNC:3749 | Ensembl Gene: ENSG00000151702 | OMIM ID: 193067 |
Screen Evidence:
| |||
Expression of FLI1:
| Dataset | Gene | EntrezID | Probe | Log2FC | Adj.pValue | Expression |
|---|---|---|---|---|---|---|
| GSE17351 | FLI1 | 2313 | 204236_at | -0.2077 | 0.8646 | |
| GSE20347 | FLI1 | 2313 | 211825_s_at | -0.1248 | 0.1626 | |
| GSE23400 | FLI1 | 2313 | 211825_s_at | -0.0717 | 0.0870 | |
| GSE26886 | FLI1 | 2313 | 204236_at | -0.7774 | 0.0199 | |
| GSE29001 | FLI1 | 2313 | 211825_s_at | -0.0710 | 0.6412 | |
| GSE38129 | FLI1 | 2313 | 204236_at | -0.5213 | 0.0233 | |
| GSE45670 | FLI1 | 2313 | 204236_at | -1.0752 | 0.0042 | |
| GSE53622 | FLI1 | 2313 | 24270 | -0.5056 | 0.0005 | |
| GSE53624 | FLI1 | 2313 | 24270 | -0.5165 | 0.0006 | |
| GSE63941 | FLI1 | 2313 | 211825_s_at | 0.4718 | 0.4337 | |
| GSE77861 | FLI1 | 2313 | 237722_at | -0.1778 | 0.0840 | |
| GSE97050 | FLI1 | 2313 | A_24_P355649 | 0.2940 | 0.3513 | |
| SRP007169 | FLI1 | 2313 | RNAseq | 0.6594 | 0.1882 | |
| SRP008496 | FLI1 | 2313 | RNAseq | 0.4522 | 0.2373 | |
| SRP064894 | FLI1 | 2313 | RNAseq | 0.2904 | 0.3549 | |
| SRP133303 | FLI1 | 2313 | RNAseq | -0.6023 | 0.0056 | |
| SRP159526 | FLI1 | 2313 | RNAseq | -0.4212 | 0.4134 | |
| SRP193095 | FLI1 | 2313 | RNAseq | 0.2491 | 0.2693 | |
| SRP219564 | FLI1 | 2313 | RNAseq | 0.0814 | 0.8185 | |
| TCGA | FLI1 | 2313 | RNAseq | -0.1954 | 0.0977 |
Upregulated datasets: 0; Downregulated datasets: 1.
Survival by FLI1 expression:
 | 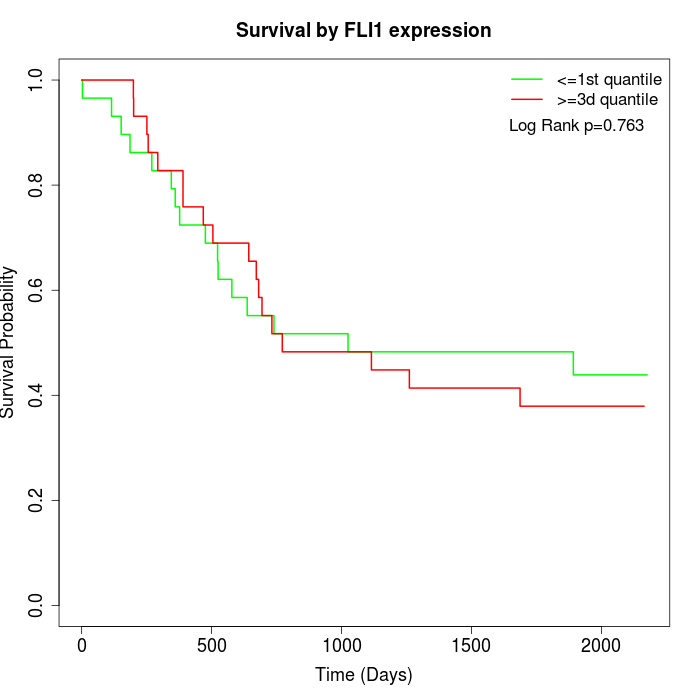 | 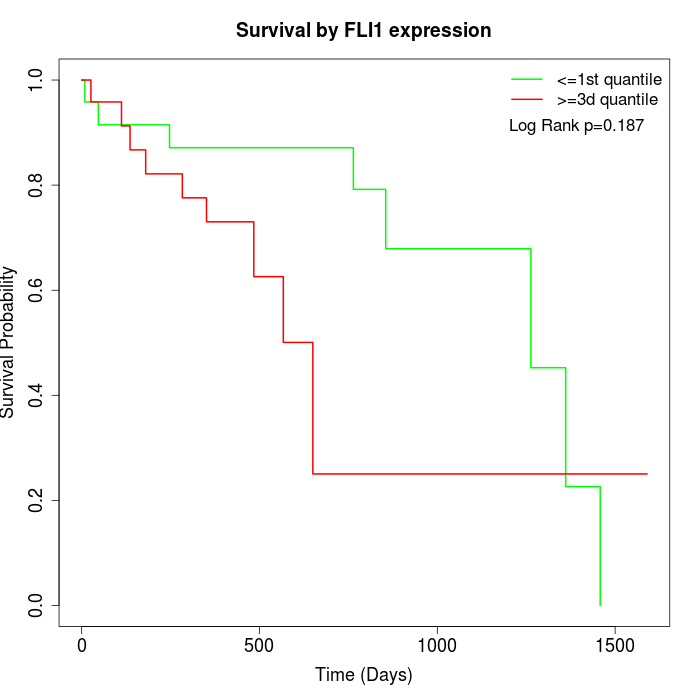 |
| GSE53622 | GSE53624 | TCGA |
Note: Click image to view full size file.
Copy number change of FLI1:
| Dataset | Gene | EntrezID | Gain | Loss | Normal | Detail |
|---|---|---|---|---|---|---|
| GSE15526 | FLI1 | 2313 | 0 | 14 | 16 | |
| GSE20123 | FLI1 | 2313 | 0 | 14 | 16 | |
| GSE43470 | FLI1 | 2313 | 2 | 7 | 34 | |
| GSE46452 | FLI1 | 2313 | 3 | 26 | 30 | |
| GSE47630 | FLI1 | 2313 | 2 | 19 | 19 | |
| GSE54993 | FLI1 | 2313 | 10 | 0 | 60 | |
| GSE54994 | FLI1 | 2313 | 5 | 19 | 29 | |
| GSE60625 | FLI1 | 2313 | 0 | 3 | 8 | |
| GSE74703 | FLI1 | 2313 | 1 | 5 | 30 | |
| GSE74704 | FLI1 | 2313 | 0 | 10 | 10 | |
| TCGA | FLI1 | 2313 | 5 | 51 | 40 |
Total number of gains: 28; Total number of losses: 168; Total Number of normals: 292.
Somatic mutations of FLI1:
Generating mutation plots.
Highly correlated genes for FLI1:
Showing top 20/762 corelated genes with mean PCC>0.5.
| Gene1 | Gene2 | Mean PCC | Num. Datasets | Num. PCC<0 | Num. PCC>0.5 |
|---|---|---|---|---|---|
| FLI1 | MPEG1 | 0.849306 | 6 | 0 | 6 |
| FLI1 | GIMAP1 | 0.806892 | 7 | 0 | 7 |
| FLI1 | GIMAP4 | 0.805581 | 9 | 0 | 8 |
| FLI1 | GIMAP7 | 0.799911 | 7 | 0 | 7 |
| FLI1 | PHACTR1 | 0.795162 | 4 | 0 | 4 |
| FLI1 | PHLDB1 | 0.783122 | 4 | 0 | 4 |
| FLI1 | GIMAP8 | 0.783113 | 7 | 0 | 6 |
| FLI1 | GIMAP5 | 0.771832 | 4 | 0 | 3 |
| FLI1 | GAB3 | 0.76736 | 7 | 0 | 7 |
| FLI1 | BHLHE22 | 0.761942 | 6 | 0 | 6 |
| FLI1 | CD53 | 0.759288 | 6 | 0 | 6 |
| FLI1 | ARHGAP15 | 0.7592 | 4 | 0 | 4 |
| FLI1 | C19orf38 | 0.758694 | 3 | 0 | 3 |
| FLI1 | GIMAP6 | 0.757535 | 10 | 0 | 8 |
| FLI1 | RGS18 | 0.756006 | 7 | 0 | 6 |
| FLI1 | NOA1 | 0.755087 | 3 | 0 | 3 |
| FLI1 | C16orf54 | 0.754018 | 7 | 0 | 7 |
| FLI1 | NLGN4X | 0.753208 | 3 | 0 | 3 |
| FLI1 | GNGT2 | 0.747938 | 4 | 0 | 4 |
| FLI1 | CSF1R | 0.740861 | 8 | 0 | 8 |
For details and further investigation, click here