| Full name: GDP-D-glucose phosphorylase 1 | Alias Symbol: | ||
| Type: protein-coding gene | Cytoband: 15q26.1 | ||
| Entrez ID: 390637 | HGNC ID: HGNC:34360 | Ensembl Gene: ENSG00000183208 | OMIM ID: |
Expression of GDPGP1:
| Dataset | Gene | EntrezID | Probe | Log2FC | Adj.pValue | Expression |
|---|---|---|---|---|---|---|
| GSE17351 | GDPGP1 | 390637 | 1565150_at | 0.1164 | 0.7192 | |
| GSE26886 | GDPGP1 | 390637 | 1565150_at | 0.2304 | 0.0322 | |
| GSE45670 | GDPGP1 | 390637 | 1565150_at | 0.3798 | 0.0240 | |
| GSE53622 | GDPGP1 | 390637 | 91507 | 0.2625 | 0.0023 | |
| GSE53624 | GDPGP1 | 390637 | 91507 | -0.0889 | 0.2835 | |
| GSE63941 | GDPGP1 | 390637 | 1565150_at | 0.1377 | 0.6067 | |
| GSE77861 | GDPGP1 | 390637 | 1565150_at | 0.1036 | 0.4568 | |
| SRP007169 | GDPGP1 | 390637 | RNAseq | 0.4617 | 0.3979 | |
| SRP064894 | GDPGP1 | 390637 | RNAseq | 0.2789 | 0.1844 | |
| SRP133303 | GDPGP1 | 390637 | RNAseq | 0.0889 | 0.4238 | |
| SRP159526 | GDPGP1 | 390637 | RNAseq | 0.5807 | 0.0580 | |
| SRP193095 | GDPGP1 | 390637 | RNAseq | 0.1137 | 0.3157 | |
| SRP219564 | GDPGP1 | 390637 | RNAseq | 0.1230 | 0.6543 |
Upregulated datasets: 0; Downregulated datasets: 0.
Survival by GDPGP1 expression:
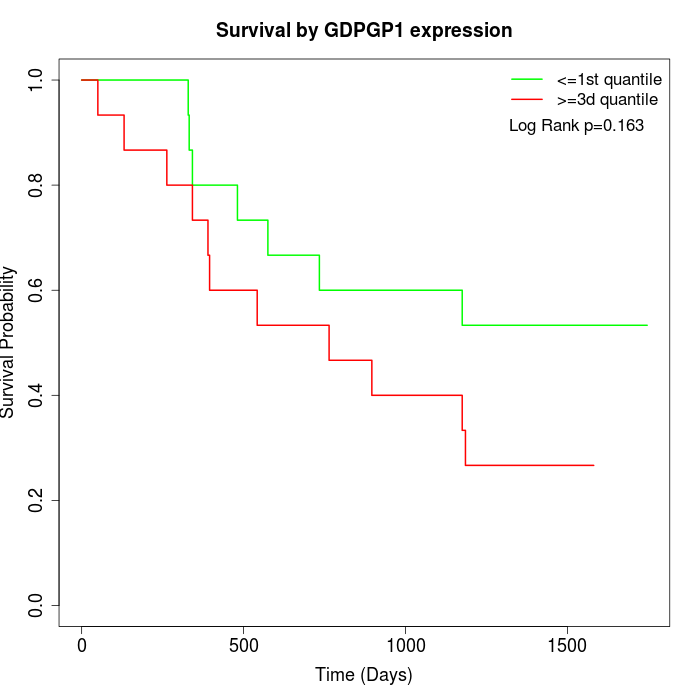 | 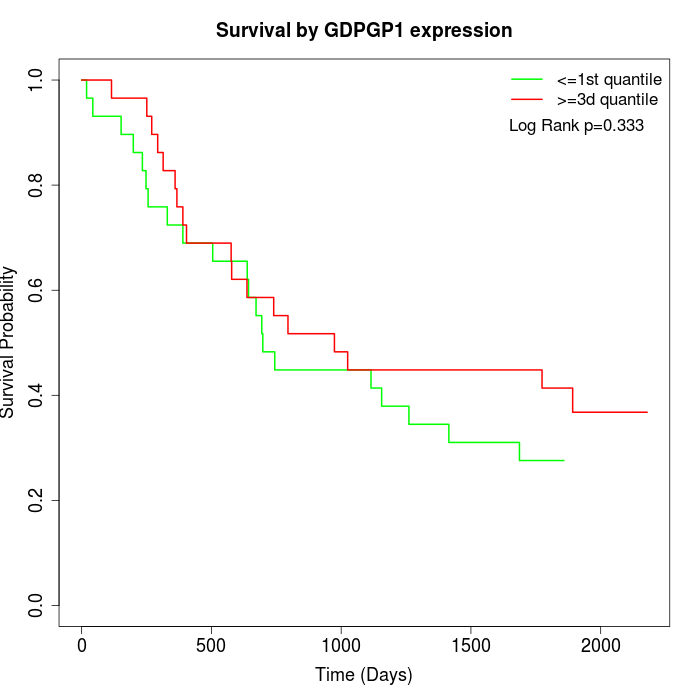 |
| GSE53622 | GSE53624 |
Note: Click image to view full size file.
Copy number change of GDPGP1:
| Dataset | Gene | EntrezID | Gain | Loss | Normal | Detail |
|---|---|---|---|---|---|---|
| GSE15526 | GDPGP1 | 390637 | 8 | 3 | 19 | |
| GSE20123 | GDPGP1 | 390637 | 8 | 3 | 19 | |
| GSE43470 | GDPGP1 | 390637 | 5 | 5 | 33 | |
| GSE46452 | GDPGP1 | 390637 | 3 | 7 | 49 | |
| GSE47630 | GDPGP1 | 390637 | 8 | 11 | 21 | |
| GSE54993 | GDPGP1 | 390637 | 4 | 6 | 60 | |
| GSE54994 | GDPGP1 | 390637 | 7 | 6 | 40 | |
| GSE60625 | GDPGP1 | 390637 | 4 | 0 | 7 | |
| GSE74703 | GDPGP1 | 390637 | 4 | 4 | 28 | |
| GSE74704 | GDPGP1 | 390637 | 4 | 2 | 14 | |
| TCGA | GDPGP1 | 390637 | 18 | 12 | 66 |
Total number of gains: 73; Total number of losses: 59; Total Number of normals: 356.
Somatic mutations of GDPGP1:
Generating mutation plots.
Highly correlated genes for GDPGP1:
Showing top 20/87 corelated genes with mean PCC>0.5.
| Gene1 | Gene2 | Mean PCC | Num. Datasets | Num. PCC<0 | Num. PCC>0.5 |
|---|---|---|---|---|---|
| GDPGP1 | KCNH3 | 0.735823 | 3 | 0 | 3 |
| GDPGP1 | TSPAN11 | 0.723505 | 3 | 0 | 3 |
| GDPGP1 | TMEM105 | 0.720222 | 3 | 0 | 3 |
| GDPGP1 | CELA3A | 0.709105 | 3 | 0 | 3 |
| GDPGP1 | C6orf15 | 0.685085 | 3 | 0 | 3 |
| GDPGP1 | TMEM235 | 0.681835 | 3 | 0 | 3 |
| GDPGP1 | PVALB | 0.68084 | 3 | 0 | 3 |
| GDPGP1 | LYN | 0.677823 | 3 | 0 | 3 |
| GDPGP1 | LINC00930 | 0.677715 | 3 | 0 | 3 |
| GDPGP1 | PANX2 | 0.671961 | 4 | 0 | 3 |
| GDPGP1 | NF2 | 0.665454 | 3 | 0 | 3 |
| GDPGP1 | ZNF236 | 0.652165 | 5 | 0 | 3 |
| GDPGP1 | LAMC3 | 0.651821 | 3 | 0 | 3 |
| GDPGP1 | ABCC1 | 0.647716 | 3 | 0 | 3 |
| GDPGP1 | IFNL2 | 0.647126 | 4 | 0 | 3 |
| GDPGP1 | TUBG1 | 0.646116 | 3 | 0 | 3 |
| GDPGP1 | POM121L12 | 0.644171 | 3 | 0 | 3 |
| GDPGP1 | KRTAP2-1 | 0.635434 | 3 | 0 | 3 |
| GDPGP1 | CLDN19 | 0.631672 | 4 | 0 | 4 |
| GDPGP1 | C2orf81 | 0.630306 | 3 | 0 | 3 |
For details and further investigation, click here