| Full name: chymotrypsin like elastase 3A | Alias Symbol: ELA3 | ||
| Type: protein-coding gene | Cytoband: 1p36.12 | ||
| Entrez ID: 10136 | HGNC ID: HGNC:15944 | Ensembl Gene: ENSG00000142789 | OMIM ID: |
Expression of CELA3A:
| Dataset | Gene | EntrezID | Probe | Log2FC | Adj.pValue | Expression |
|---|---|---|---|---|---|---|
| GSE17351 | CELA3A | 10136 | 211738_x_at | -0.0056 | 0.9870 | |
| GSE20347 | CELA3A | 10136 | 211738_x_at | 0.0048 | 0.9638 | |
| GSE23400 | CELA3A | 10136 | 211738_x_at | -0.0477 | 0.2815 | |
| GSE26886 | CELA3A | 10136 | 211738_x_at | -0.0273 | 0.8699 | |
| GSE29001 | CELA3A | 10136 | 210080_x_at | 0.0344 | 0.8431 | |
| GSE38129 | CELA3A | 10136 | 211738_x_at | -0.2389 | 0.2417 | |
| GSE45670 | CELA3A | 10136 | 211738_x_at | 0.1440 | 0.1756 | |
| GSE53622 | CELA3A | 10136 | 4182 | 0.2034 | 0.0203 | |
| GSE53624 | CELA3A | 10136 | 4182 | 0.1548 | 0.2654 | |
| GSE63941 | CELA3A | 10136 | 211738_x_at | 0.0595 | 0.7924 | |
| GSE77861 | CELA3A | 10136 | 211738_x_at | -0.1495 | 0.1794 | |
| GSE97050 | CELA3A | 10136 | A_33_P3343727 | -0.0546 | 0.7940 | |
| TCGA | CELA3A | 10136 | RNAseq | -7.0940 | 0.0018 |
Upregulated datasets: 0; Downregulated datasets: 1.
Survival by CELA3A expression:
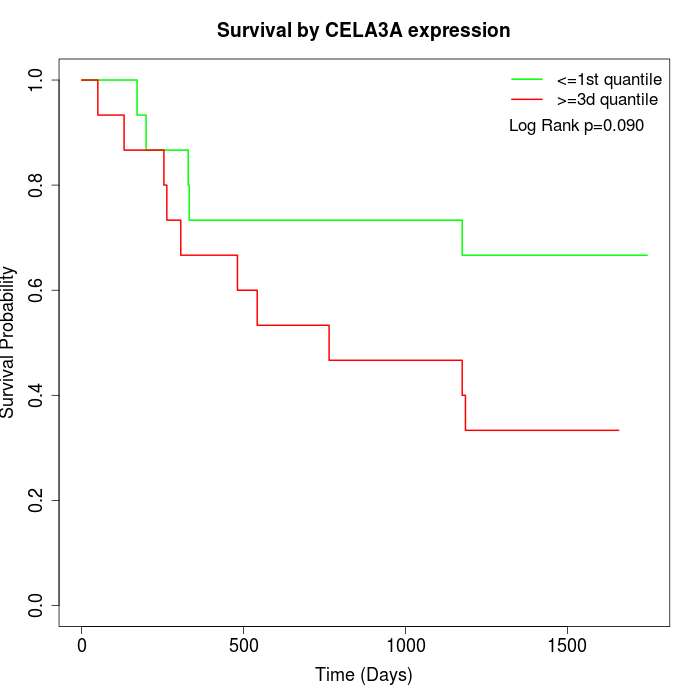 | 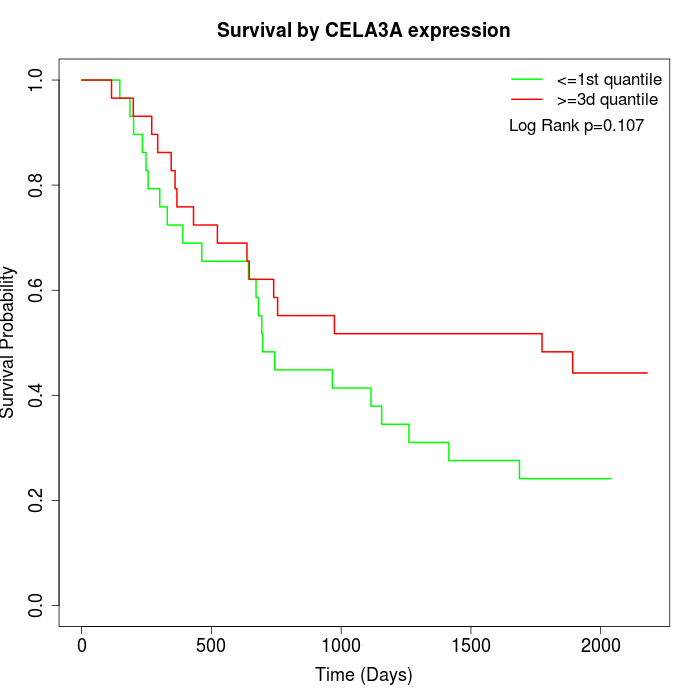 | 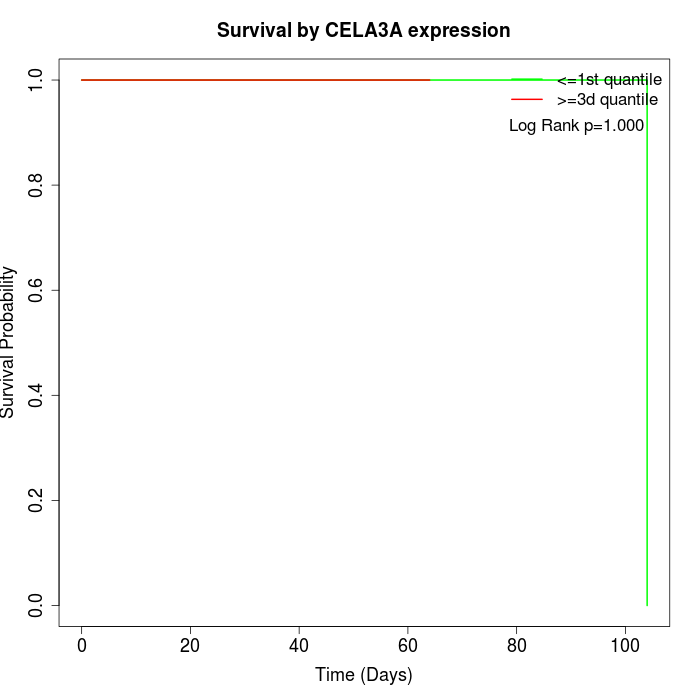 |
| GSE53622 | GSE53624 | TCGA |
Note: Click image to view full size file.
Copy number change of CELA3A:
| Dataset | Gene | EntrezID | Gain | Loss | Normal | Detail |
|---|---|---|---|---|---|---|
| GSE15526 | CELA3A | 10136 | 0 | 5 | 25 | |
| GSE20123 | CELA3A | 10136 | 0 | 4 | 26 | |
| GSE43470 | CELA3A | 10136 | 2 | 6 | 35 | |
| GSE46452 | CELA3A | 10136 | 5 | 1 | 53 | |
| GSE47630 | CELA3A | 10136 | 8 | 3 | 29 | |
| GSE54993 | CELA3A | 10136 | 2 | 1 | 67 | |
| GSE54994 | CELA3A | 10136 | 11 | 4 | 38 | |
| GSE60625 | CELA3A | 10136 | 0 | 0 | 11 | |
| GSE74703 | CELA3A | 10136 | 1 | 4 | 31 | |
| GSE74704 | CELA3A | 10136 | 0 | 0 | 20 | |
| TCGA | CELA3A | 10136 | 9 | 23 | 64 |
Total number of gains: 38; Total number of losses: 51; Total Number of normals: 399.
Somatic mutations of CELA3A:
Generating mutation plots.
Highly correlated genes for CELA3A:
Showing top 20/486 corelated genes with mean PCC>0.5.
| Gene1 | Gene2 | Mean PCC | Num. Datasets | Num. PCC<0 | Num. PCC>0.5 |
|---|---|---|---|---|---|
| CELA3A | SPEG | 0.824469 | 3 | 0 | 3 |
| CELA3A | KRTAP12-2 | 0.817033 | 3 | 0 | 3 |
| CELA3A | UBE2NL | 0.810105 | 3 | 0 | 3 |
| CELA3A | OR2T33 | 0.802601 | 3 | 0 | 3 |
| CELA3A | SLC26A5 | 0.797188 | 3 | 0 | 3 |
| CELA3A | OR2AT4 | 0.785659 | 3 | 0 | 3 |
| CELA3A | KLF16 | 0.779945 | 3 | 0 | 3 |
| CELA3A | CATSPER1 | 0.779775 | 3 | 0 | 3 |
| CELA3A | ALG11 | 0.774206 | 3 | 0 | 3 |
| CELA3A | KIR3DL2 | 0.772752 | 3 | 0 | 3 |
| CELA3A | NF2 | 0.760626 | 3 | 0 | 3 |
| CELA3A | KRTAP10-9 | 0.759591 | 3 | 0 | 3 |
| CELA3A | TRAFD1 | 0.755276 | 3 | 0 | 3 |
| CELA3A | ATP6V0E1 | 0.754409 | 3 | 0 | 3 |
| CELA3A | SFTPA2 | 0.752313 | 3 | 0 | 3 |
| CELA3A | ALPI | 0.750644 | 4 | 0 | 4 |
| CELA3A | LINC00271 | 0.74817 | 3 | 0 | 3 |
| CELA3A | ERCC4 | 0.73535 | 3 | 0 | 3 |
| CELA3A | OR1L6 | 0.733988 | 3 | 0 | 3 |
| CELA3A | CPA2 | 0.733871 | 5 | 0 | 5 |
For details and further investigation, click here