| Full name: lipopolysaccharide binding protein | Alias Symbol: BPIFD2 | ||
| Type: protein-coding gene | Cytoband: 20q11.23 | ||
| Entrez ID: 3929 | HGNC ID: HGNC:6517 | Ensembl Gene: ENSG00000129988 | OMIM ID: 151990 |
Expression of LBP:
| Dataset | Gene | EntrezID | Probe | Log2FC | Adj.pValue | Expression |
|---|---|---|---|---|---|---|
| GSE17351 | LBP | 3929 | 211652_s_at | 0.2165 | 0.6496 | |
| GSE20347 | LBP | 3929 | 211652_s_at | 0.0419 | 0.7327 | |
| GSE23400 | LBP | 3929 | 211652_s_at | -0.0803 | 0.1127 | |
| GSE26886 | LBP | 3929 | 211652_s_at | -0.0947 | 0.5632 | |
| GSE29001 | LBP | 3929 | 211652_s_at | -0.0849 | 0.6245 | |
| GSE38129 | LBP | 3929 | 211652_s_at | -0.0257 | 0.8427 | |
| GSE45670 | LBP | 3929 | 211652_s_at | 0.0878 | 0.3815 | |
| GSE53622 | LBP | 3929 | 47562 | 0.4956 | 0.0161 | |
| GSE53624 | LBP | 3929 | 47562 | 1.0317 | 0.0000 | |
| GSE63941 | LBP | 3929 | 211652_s_at | -0.1640 | 0.3700 | |
| GSE77861 | LBP | 3929 | 211652_s_at | 0.0557 | 0.6754 | |
| GSE97050 | LBP | 3929 | A_23_P143178 | 0.7071 | 0.3817 | |
| TCGA | LBP | 3929 | RNAseq | 2.2786 | 0.0978 |
Upregulated datasets: 1; Downregulated datasets: 0.
Survival by LBP expression:
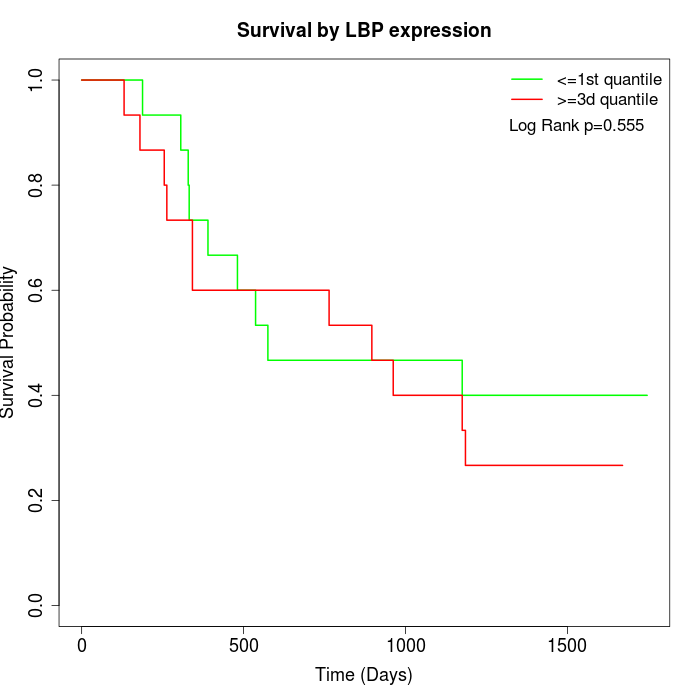 | 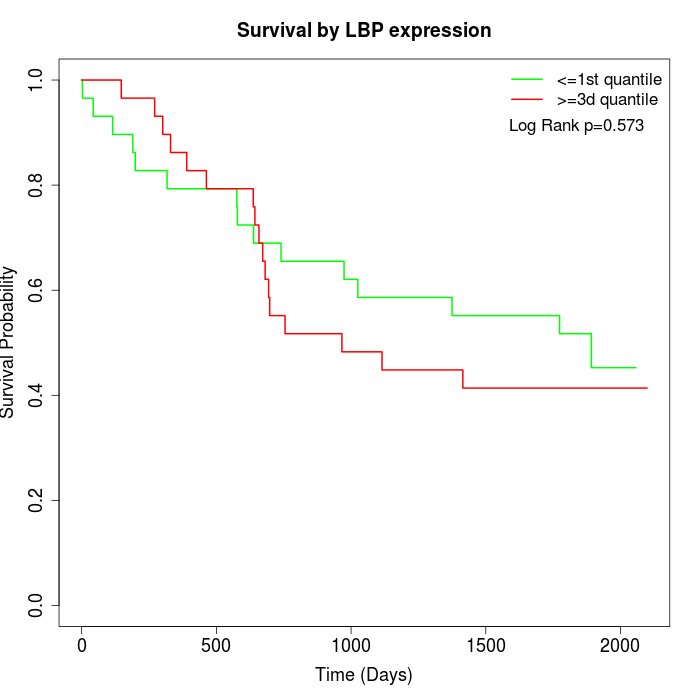 | 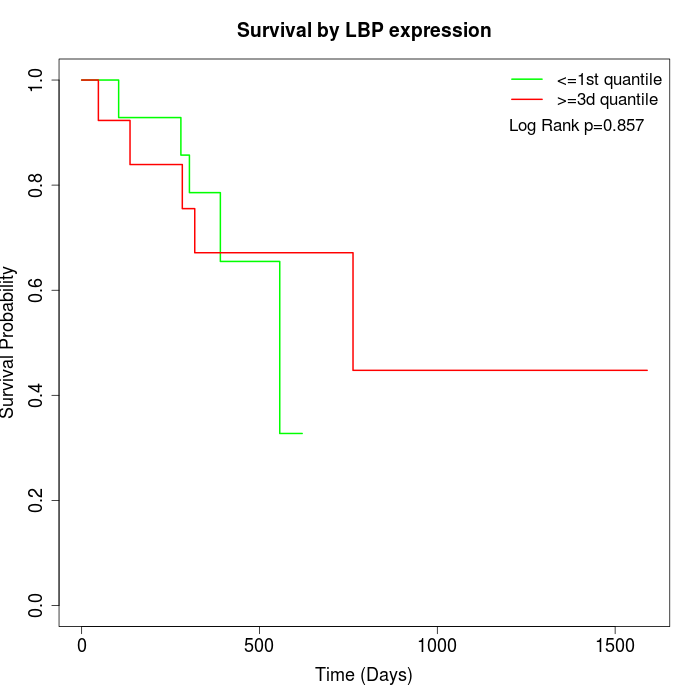 |
| GSE53622 | GSE53624 | TCGA |
Note: Click image to view full size file.
Copy number change of LBP:
| Dataset | Gene | EntrezID | Gain | Loss | Normal | Detail |
|---|---|---|---|---|---|---|
| GSE15526 | LBP | 3929 | 14 | 2 | 14 | |
| GSE20123 | LBP | 3929 | 14 | 2 | 14 | |
| GSE43470 | LBP | 3929 | 13 | 0 | 30 | |
| GSE46452 | LBP | 3929 | 29 | 0 | 30 | |
| GSE47630 | LBP | 3929 | 24 | 0 | 16 | |
| GSE54993 | LBP | 3929 | 0 | 17 | 53 | |
| GSE54994 | LBP | 3929 | 23 | 1 | 29 | |
| GSE60625 | LBP | 3929 | 0 | 0 | 11 | |
| GSE74703 | LBP | 3929 | 10 | 0 | 26 | |
| GSE74704 | LBP | 3929 | 10 | 1 | 9 | |
| TCGA | LBP | 3929 | 47 | 4 | 45 |
Total number of gains: 184; Total number of losses: 27; Total Number of normals: 277.
Somatic mutations of LBP:
Generating mutation plots.
Highly correlated genes for LBP:
Showing top 20/511 corelated genes with mean PCC>0.5.
| Gene1 | Gene2 | Mean PCC | Num. Datasets | Num. PCC<0 | Num. PCC>0.5 |
|---|---|---|---|---|---|
| LBP | KIR2DS5 | 0.713588 | 4 | 0 | 3 |
| LBP | GML | 0.710617 | 5 | 0 | 5 |
| LBP | ALDOB | 0.709479 | 3 | 0 | 3 |
| LBP | GP2 | 0.707677 | 4 | 0 | 4 |
| LBP | LINC01049 | 0.6996 | 3 | 0 | 3 |
| LBP | NEURL1 | 0.699326 | 4 | 0 | 4 |
| LBP | IL1RAPL2 | 0.692788 | 6 | 0 | 5 |
| LBP | OXCT2 | 0.691035 | 3 | 0 | 3 |
| LBP | ZC3H3 | 0.68556 | 3 | 0 | 3 |
| LBP | TMEM237 | 0.682511 | 3 | 0 | 3 |
| LBP | MNT | 0.681201 | 4 | 0 | 4 |
| LBP | GTPBP8 | 0.681188 | 3 | 0 | 3 |
| LBP | ZNF611 | 0.67132 | 4 | 0 | 3 |
| LBP | KIF5A | 0.670208 | 4 | 0 | 4 |
| LBP | KIR2DL5A | 0.669131 | 7 | 0 | 6 |
| LBP | FOXN3-AS2 | 0.668098 | 4 | 0 | 4 |
| LBP | ZIC3 | 0.667214 | 4 | 0 | 4 |
| LBP | SH2D3C | 0.666752 | 5 | 0 | 5 |
| LBP | PRPF40A | 0.666403 | 4 | 0 | 3 |
| LBP | CHST5 | 0.66567 | 4 | 0 | 4 |
For details and further investigation, click here