| Full name: GTP binding protein 8 (putative) | Alias Symbol: HSPC135 | ||
| Type: protein-coding gene | Cytoband: 3q13.2 | ||
| Entrez ID: 29083 | HGNC ID: HGNC:25007 | Ensembl Gene: ENSG00000163607 | OMIM ID: |
Screen Evidence:
| |||
Expression of GTPBP8:
| Dataset | Gene | EntrezID | Probe | Log2FC | Adj.pValue | Expression |
|---|---|---|---|---|---|---|
| GSE17351 | GTPBP8 | 29083 | 221046_s_at | 0.4699 | 0.3119 | |
| GSE20347 | GTPBP8 | 29083 | 221046_s_at | 0.4998 | 0.0031 | |
| GSE23400 | GTPBP8 | 29083 | 221046_s_at | 0.4231 | 0.0000 | |
| GSE26886 | GTPBP8 | 29083 | 221046_s_at | 0.6420 | 0.0004 | |
| GSE29001 | GTPBP8 | 29083 | 221046_s_at | 0.4210 | 0.1807 | |
| GSE38129 | GTPBP8 | 29083 | 221046_s_at | 0.4042 | 0.0131 | |
| GSE45670 | GTPBP8 | 29083 | 221046_s_at | 0.4627 | 0.0007 | |
| GSE53622 | GTPBP8 | 29083 | 136386 | 0.0485 | 0.5176 | |
| GSE53624 | GTPBP8 | 29083 | 136386 | 0.2801 | 0.0000 | |
| GSE63941 | GTPBP8 | 29083 | 221046_s_at | 0.0523 | 0.9358 | |
| GSE77861 | GTPBP8 | 29083 | 221046_s_at | 0.3077 | 0.3294 | |
| GSE97050 | GTPBP8 | 29083 | A_23_P92281 | 0.3363 | 0.2272 | |
| SRP007169 | GTPBP8 | 29083 | RNAseq | 0.1617 | 0.7246 | |
| SRP008496 | GTPBP8 | 29083 | RNAseq | 0.1973 | 0.5245 | |
| SRP064894 | GTPBP8 | 29083 | RNAseq | 0.3595 | 0.0883 | |
| SRP133303 | GTPBP8 | 29083 | RNAseq | 0.0890 | 0.6424 | |
| SRP159526 | GTPBP8 | 29083 | RNAseq | 0.1524 | 0.6208 | |
| SRP193095 | GTPBP8 | 29083 | RNAseq | -0.0548 | 0.6266 | |
| SRP219564 | GTPBP8 | 29083 | RNAseq | -0.4698 | 0.1870 | |
| TCGA | GTPBP8 | 29083 | RNAseq | 0.1075 | 0.1273 |
Upregulated datasets: 0; Downregulated datasets: 0.
Survival by GTPBP8 expression:
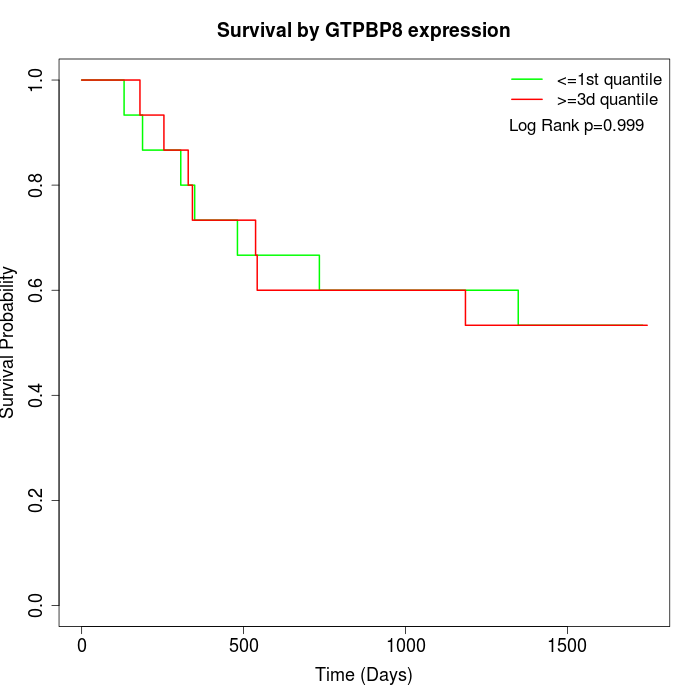 | 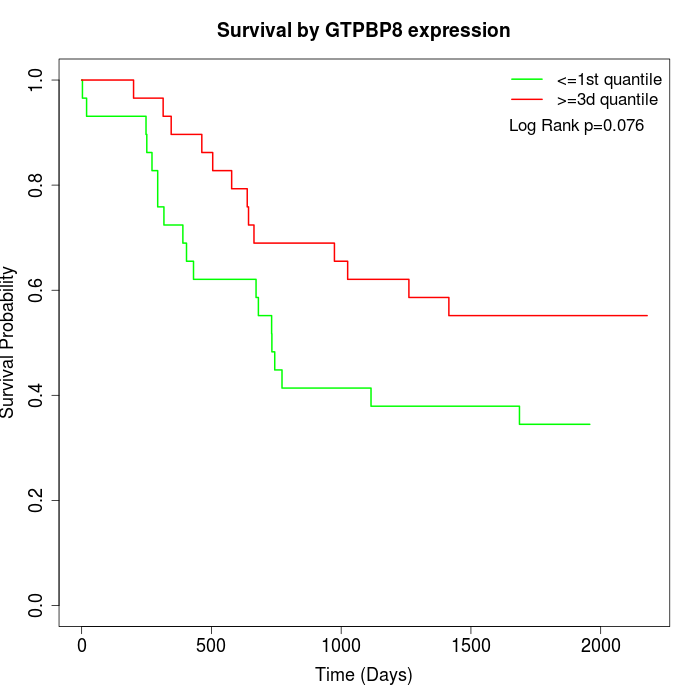 | 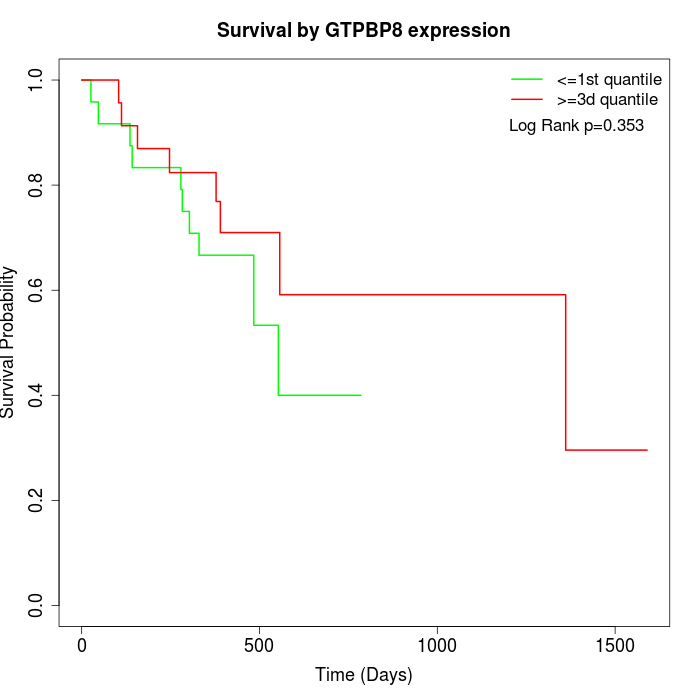 |
| GSE53622 | GSE53624 | TCGA |
Note: Click image to view full size file.
Copy number change of GTPBP8:
| Dataset | Gene | EntrezID | Gain | Loss | Normal | Detail |
|---|---|---|---|---|---|---|
| GSE15526 | GTPBP8 | 29083 | 16 | 1 | 13 | |
| GSE20123 | GTPBP8 | 29083 | 16 | 1 | 13 | |
| GSE43470 | GTPBP8 | 29083 | 20 | 1 | 22 | |
| GSE46452 | GTPBP8 | 29083 | 13 | 5 | 41 | |
| GSE47630 | GTPBP8 | 29083 | 16 | 6 | 18 | |
| GSE54993 | GTPBP8 | 29083 | 2 | 5 | 63 | |
| GSE54994 | GTPBP8 | 29083 | 29 | 4 | 20 | |
| GSE60625 | GTPBP8 | 29083 | 0 | 6 | 5 | |
| GSE74703 | GTPBP8 | 29083 | 16 | 1 | 19 | |
| GSE74704 | GTPBP8 | 29083 | 12 | 1 | 7 | |
| TCGA | GTPBP8 | 29083 | 52 | 7 | 37 |
Total number of gains: 192; Total number of losses: 38; Total Number of normals: 258.
Somatic mutations of GTPBP8:
Generating mutation plots.
Highly correlated genes for GTPBP8:
Showing top 20/859 corelated genes with mean PCC>0.5.
| Gene1 | Gene2 | Mean PCC | Num. Datasets | Num. PCC<0 | Num. PCC>0.5 |
|---|---|---|---|---|---|
| GTPBP8 | C12orf45 | 0.799647 | 3 | 0 | 3 |
| GTPBP8 | B3GALT6 | 0.764883 | 3 | 0 | 3 |
| GTPBP8 | PPP1R16A | 0.764414 | 3 | 0 | 3 |
| GTPBP8 | ZNF680 | 0.761763 | 3 | 0 | 3 |
| GTPBP8 | MBD4 | 0.761735 | 8 | 0 | 8 |
| GTPBP8 | PAK1IP1 | 0.751115 | 5 | 0 | 5 |
| GTPBP8 | NTPCR | 0.736401 | 3 | 0 | 3 |
| GTPBP8 | SLC39A10 | 0.736019 | 3 | 0 | 3 |
| GTPBP8 | PSMG4 | 0.727025 | 3 | 0 | 3 |
| GTPBP8 | SPIRE2 | 0.714087 | 4 | 0 | 4 |
| GTPBP8 | SP110 | 0.712567 | 4 | 0 | 4 |
| GTPBP8 | XRN1 | 0.71164 | 3 | 0 | 3 |
| GTPBP8 | SEC61A2 | 0.710343 | 3 | 0 | 3 |
| GTPBP8 | DICER1 | 0.706736 | 3 | 0 | 3 |
| GTPBP8 | RPL7L1 | 0.702634 | 4 | 0 | 3 |
| GTPBP8 | PHOSPHO2 | 0.702497 | 3 | 0 | 3 |
| GTPBP8 | MRPL55 | 0.701385 | 3 | 0 | 3 |
| GTPBP8 | POLG | 0.700959 | 3 | 0 | 3 |
| GTPBP8 | RNF217 | 0.699097 | 4 | 0 | 3 |
| GTPBP8 | ZNF628 | 0.693868 | 3 | 0 | 3 |
For details and further investigation, click here