| Full name: meprin A subunit beta | Alias Symbol: | ||
| Type: protein-coding gene | Cytoband: 18q12.2-q12.3 | ||
| Entrez ID: 4225 | HGNC ID: HGNC:7020 | Ensembl Gene: ENSG00000141434 | OMIM ID: 600389 |
Expression of MEP1B:
| Dataset | Gene | EntrezID | Probe | Log2FC | Adj.pValue | Expression |
|---|---|---|---|---|---|---|
| GSE17351 | MEP1B | 4225 | 207251_at | 0.0176 | 0.9610 | |
| GSE20347 | MEP1B | 4225 | 207251_at | 0.0027 | 0.9762 | |
| GSE23400 | MEP1B | 4225 | 207251_at | -0.1157 | 0.0348 | |
| GSE26886 | MEP1B | 4225 | 207251_at | -0.1294 | 0.2102 | |
| GSE29001 | MEP1B | 4225 | 207251_at | -0.1919 | 0.3434 | |
| GSE38129 | MEP1B | 4225 | 207251_at | -0.1255 | 0.0892 | |
| GSE45670 | MEP1B | 4225 | 207251_at | 0.0375 | 0.6656 | |
| GSE53622 | MEP1B | 4225 | 65217 | -0.1849 | 0.1022 | |
| GSE53624 | MEP1B | 4225 | 65217 | 0.1774 | 0.0451 | |
| GSE63941 | MEP1B | 4225 | 207251_at | 0.1241 | 0.4223 | |
| GSE77861 | MEP1B | 4225 | 207251_at | -0.0547 | 0.5975 | |
| GSE97050 | MEP1B | 4225 | A_23_P78353 | -0.1292 | 0.5584 | |
| SRP133303 | MEP1B | 4225 | RNAseq | -1.3340 | 0.0000 | |
| TCGA | MEP1B | 4225 | RNAseq | -0.5771 | 0.4695 |
Upregulated datasets: 0; Downregulated datasets: 1.
Survival by MEP1B expression:
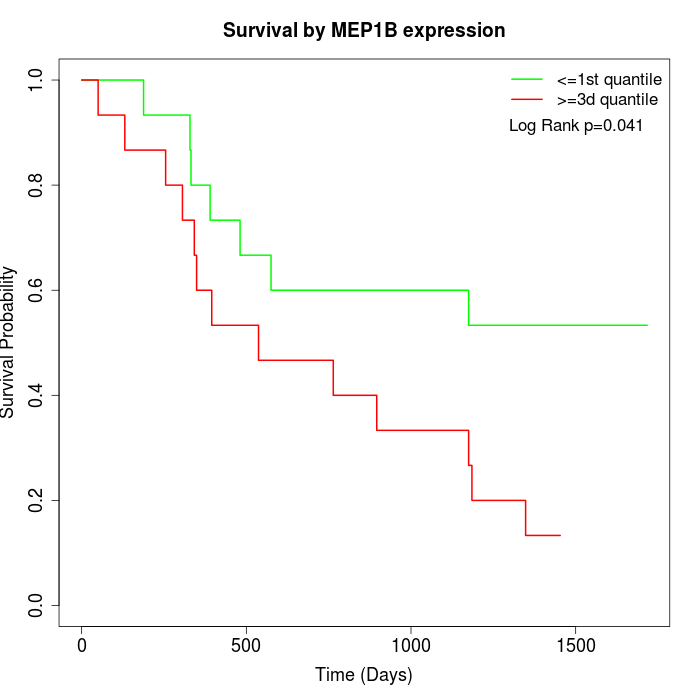 | 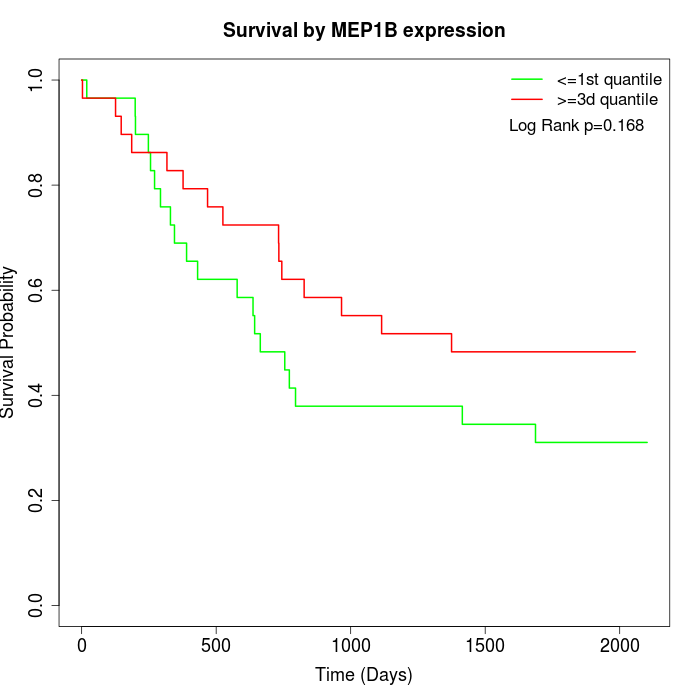 | 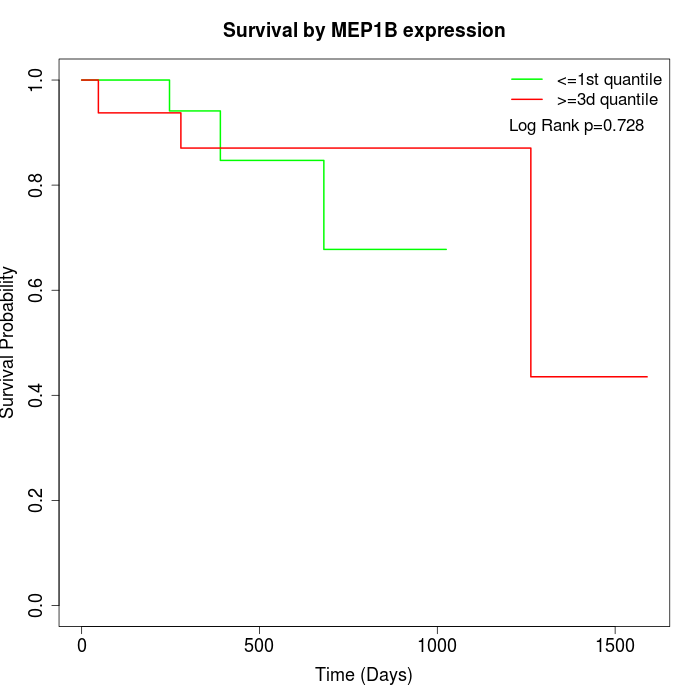 |
| GSE53622 | GSE53624 | TCGA |
Note: Click image to view full size file.
Copy number change of MEP1B:
| Dataset | Gene | EntrezID | Gain | Loss | Normal | Detail |
|---|---|---|---|---|---|---|
| GSE15526 | MEP1B | 4225 | 1 | 6 | 23 | |
| GSE20123 | MEP1B | 4225 | 1 | 6 | 23 | |
| GSE43470 | MEP1B | 4225 | 0 | 3 | 40 | |
| GSE46452 | MEP1B | 4225 | 1 | 25 | 33 | |
| GSE47630 | MEP1B | 4225 | 5 | 20 | 15 | |
| GSE54993 | MEP1B | 4225 | 8 | 1 | 61 | |
| GSE54994 | MEP1B | 4225 | 1 | 16 | 36 | |
| GSE60625 | MEP1B | 4225 | 0 | 4 | 7 | |
| GSE74703 | MEP1B | 4225 | 0 | 3 | 33 | |
| GSE74704 | MEP1B | 4225 | 0 | 5 | 15 | |
| TCGA | MEP1B | 4225 | 14 | 35 | 47 |
Total number of gains: 31; Total number of losses: 124; Total Number of normals: 333.
Somatic mutations of MEP1B:
Generating mutation plots.
Highly correlated genes for MEP1B:
Showing top 20/595 corelated genes with mean PCC>0.5.
| Gene1 | Gene2 | Mean PCC | Num. Datasets | Num. PCC<0 | Num. PCC>0.5 |
|---|---|---|---|---|---|
| MEP1B | OBSL1 | 0.873379 | 3 | 0 | 3 |
| MEP1B | MAGEA8 | 0.828597 | 3 | 0 | 3 |
| MEP1B | ATP2A1 | 0.769486 | 3 | 0 | 3 |
| MEP1B | BEAN1 | 0.746467 | 3 | 0 | 3 |
| MEP1B | ROS1 | 0.743472 | 3 | 0 | 3 |
| MEP1B | LINC00302 | 0.710867 | 3 | 0 | 3 |
| MEP1B | TP53TG5 | 0.709441 | 4 | 0 | 4 |
| MEP1B | MUC5AC | 0.70591 | 4 | 0 | 4 |
| MEP1B | APCS | 0.699806 | 4 | 0 | 4 |
| MEP1B | PTPRN2 | 0.699452 | 4 | 0 | 4 |
| MEP1B | IL9 | 0.698193 | 3 | 0 | 3 |
| MEP1B | AZU1 | 0.69623 | 3 | 0 | 3 |
| MEP1B | SEC14L4 | 0.687911 | 3 | 0 | 3 |
| MEP1B | PRAMEF12 | 0.685444 | 7 | 0 | 6 |
| MEP1B | PRODH2 | 0.682804 | 7 | 0 | 7 |
| MEP1B | IL21 | 0.678678 | 4 | 0 | 3 |
| MEP1B | FABP7 | 0.673696 | 3 | 0 | 3 |
| MEP1B | IQCH | 0.67129 | 3 | 0 | 3 |
| MEP1B | PGC | 0.669942 | 4 | 0 | 3 |
| MEP1B | FAM163A | 0.668154 | 4 | 0 | 3 |
For details and further investigation, click here