| Full name: mitochondrial translational release factor 1 like | Alias Symbol: HMRF1L|mtRF1a | ||
| Type: protein-coding gene | Cytoband: 6q25.2 | ||
| Entrez ID: 54516 | HGNC ID: HGNC:21051 | Ensembl Gene: ENSG00000112031 | OMIM ID: 613542 |
| Drug and gene relationship at DGIdb | |||
Screen Evidence:
| |||
Expression of MTRF1L:
| Dataset | Gene | EntrezID | Probe | Log2FC | Adj.pValue | Expression |
|---|---|---|---|---|---|---|
| GSE17351 | MTRF1L | 54516 | 225215_s_at | -0.2438 | 0.3734 | |
| GSE20347 | MTRF1L | 54516 | 215560_x_at | 0.1664 | 0.1844 | |
| GSE23400 | MTRF1L | 54516 | 215560_x_at | -0.0374 | 0.2465 | |
| GSE26886 | MTRF1L | 54516 | 225215_s_at | -0.2223 | 0.2022 | |
| GSE29001 | MTRF1L | 54516 | 215560_x_at | 0.0945 | 0.3863 | |
| GSE38129 | MTRF1L | 54516 | 215560_x_at | 0.0434 | 0.7448 | |
| GSE45670 | MTRF1L | 54516 | 225215_s_at | 0.0218 | 0.8918 | |
| GSE53622 | MTRF1L | 54516 | 95166 | -0.1434 | 0.0314 | |
| GSE53624 | MTRF1L | 54516 | 95166 | -0.2068 | 0.0487 | |
| GSE63941 | MTRF1L | 54516 | 225215_s_at | -0.7957 | 0.0516 | |
| GSE77861 | MTRF1L | 54516 | 225215_s_at | 0.1530 | 0.4936 | |
| GSE97050 | MTRF1L | 54516 | A_33_P3352449 | -0.1345 | 0.5833 | |
| SRP007169 | MTRF1L | 54516 | RNAseq | 0.9337 | 0.0124 | |
| SRP008496 | MTRF1L | 54516 | RNAseq | 0.9247 | 0.0031 | |
| SRP064894 | MTRF1L | 54516 | RNAseq | -0.0605 | 0.6398 | |
| SRP133303 | MTRF1L | 54516 | RNAseq | 0.0738 | 0.5405 | |
| SRP159526 | MTRF1L | 54516 | RNAseq | -0.1400 | 0.3150 | |
| SRP193095 | MTRF1L | 54516 | RNAseq | -0.3072 | 0.0000 | |
| SRP219564 | MTRF1L | 54516 | RNAseq | -0.5784 | 0.0904 | |
| TCGA | MTRF1L | 54516 | RNAseq | -0.1141 | 0.0709 |
Upregulated datasets: 0; Downregulated datasets: 0.
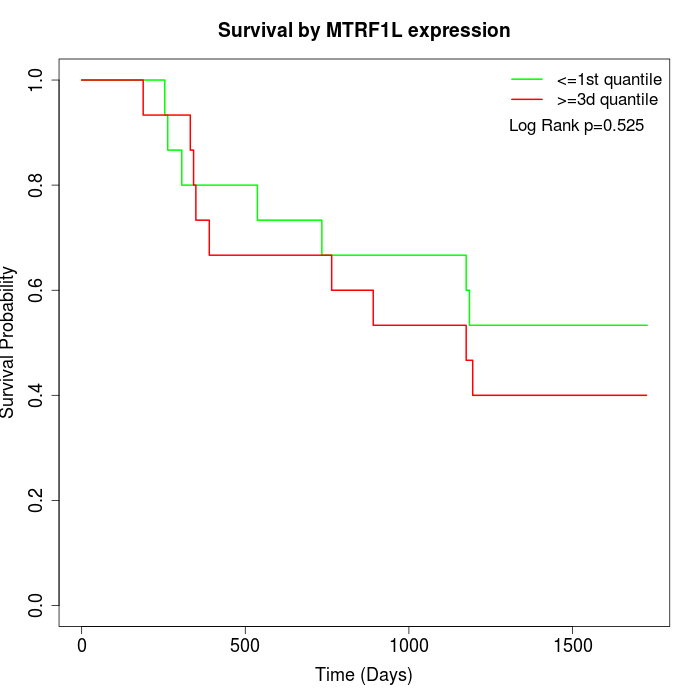
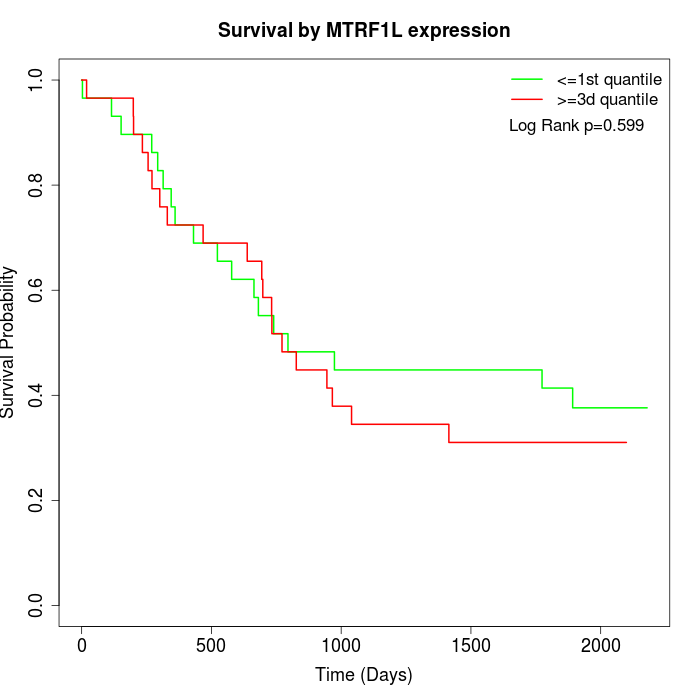
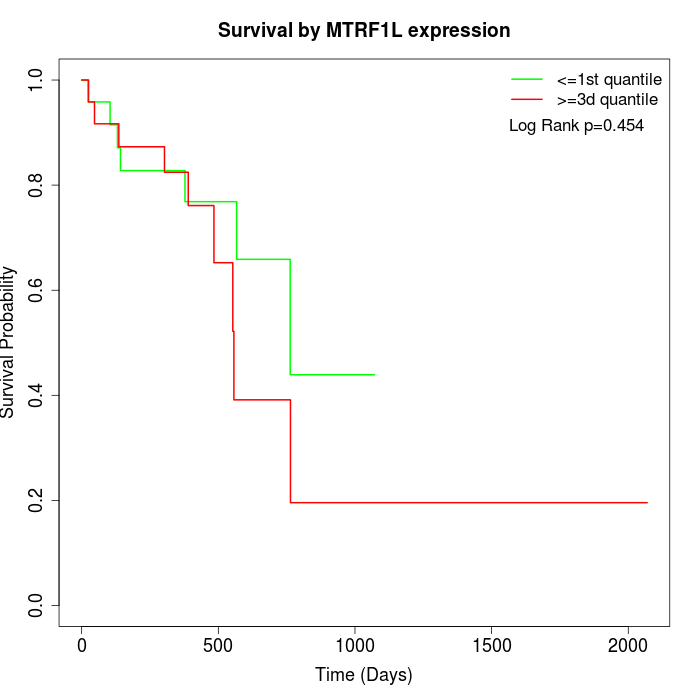
Survival by MTRF1L expression:
Note: Click image to view full size file.
Copy number change of MTRF1L:
| Dataset | Gene | EntrezID | Gain | Loss | Normal | Detail |
|---|---|---|---|---|---|---|
| GSE15526 | MTRF1L | 54516 | 1 | 4 | 25 | |
| GSE20123 | MTRF1L | 54516 | 1 | 3 | 26 | |
| GSE43470 | MTRF1L | 54516 | 4 | 0 | 39 | |
| GSE46452 | MTRF1L | 54516 | 3 | 10 | 46 | |
| GSE47630 | MTRF1L | 54516 | 9 | 4 | 27 | |
| GSE54993 | MTRF1L | 54516 | 3 | 2 | 65 | |
| GSE54994 | MTRF1L | 54516 | 8 | 8 | 37 | |
| GSE60625 | MTRF1L | 54516 | 0 | 1 | 10 | |
| GSE74703 | MTRF1L | 54516 | 4 | 0 | 32 | |
| GSE74704 | MTRF1L | 54516 | 0 | 1 | 19 | |
| TCGA | MTRF1L | 54516 | 12 | 20 | 64 |
Total number of gains: 45; Total number of losses: 53; Total Number of normals: 390.
Somatic mutations of MTRF1L:
Generating mutation plots.
Highly correlated genes for MTRF1L:
Showing top 20/329 corelated genes with mean PCC>0.5.
| Gene1 | Gene2 | Mean PCC | Num. Datasets | Num. PCC<0 | Num. PCC>0.5 |
|---|---|---|---|---|---|
| MTRF1L | LINC00328 | 0.832373 | 3 | 0 | 3 |
| MTRF1L | UBE2N | 0.791044 | 3 | 0 | 3 |
| MTRF1L | SYNE1 | 0.78148 | 3 | 0 | 3 |
| MTRF1L | RBMX2 | 0.776623 | 3 | 0 | 3 |
| MTRF1L | LRRN4CL | 0.772245 | 3 | 0 | 3 |
| MTRF1L | TAOK1 | 0.765747 | 6 | 0 | 5 |
| MTRF1L | FNIP2 | 0.765455 | 3 | 0 | 3 |
| MTRF1L | MZT2B | 0.763935 | 6 | 0 | 5 |
| MTRF1L | PSMD7 | 0.760929 | 3 | 0 | 3 |
| MTRF1L | FZD7 | 0.758186 | 3 | 0 | 3 |
| MTRF1L | ZNF721 | 0.753227 | 6 | 0 | 5 |
| MTRF1L | MRFAP1 | 0.749788 | 3 | 0 | 3 |
| MTRF1L | MTMR12 | 0.745959 | 3 | 0 | 3 |
| MTRF1L | FOXF1 | 0.745368 | 3 | 0 | 3 |
| MTRF1L | PTAR1 | 0.742065 | 3 | 0 | 3 |
| MTRF1L | SLC2A12 | 0.74136 | 3 | 0 | 3 |
| MTRF1L | FAM160B1 | 0.739628 | 3 | 0 | 3 |
| MTRF1L | MTFMT | 0.738359 | 3 | 0 | 3 |
| MTRF1L | C11orf96 | 0.736547 | 3 | 0 | 3 |
| MTRF1L | ZNF611 | 0.735183 | 5 | 0 | 4 |
For details and further investigation, click here


