| Full name: protein prenyltransferase alpha subunit repeat containing 1 | Alias Symbol: | ||
| Type: protein-coding gene | Cytoband: 9q21.12 | ||
| Entrez ID: 375743 | HGNC ID: HGNC:30449 | Ensembl Gene: ENSG00000188647 | OMIM ID: |
Screen Evidence:
| |||
Expression of PTAR1:
| Dataset | Gene | EntrezID | Probe | Log2FC | Adj.pValue | Expression |
|---|---|---|---|---|---|---|
| GSE17351 | PTAR1 | 375743 | 226110_at | -0.1422 | 0.5937 | |
| GSE26886 | PTAR1 | 375743 | 226110_at | -0.4652 | 0.0774 | |
| GSE45670 | PTAR1 | 375743 | 226110_at | -0.3074 | 0.0285 | |
| GSE53622 | PTAR1 | 375743 | 100191 | 0.0148 | 0.8454 | |
| GSE53624 | PTAR1 | 375743 | 116729 | 0.0215 | 0.7557 | |
| GSE63941 | PTAR1 | 375743 | 226110_at | -1.7486 | 0.0085 | |
| GSE77861 | PTAR1 | 375743 | 226110_at | 0.1031 | 0.7474 | |
| GSE97050 | PTAR1 | 375743 | A_33_P3209915 | -0.2249 | 0.3380 | |
| SRP007169 | PTAR1 | 375743 | RNAseq | 0.0963 | 0.8286 | |
| SRP008496 | PTAR1 | 375743 | RNAseq | 0.1360 | 0.5422 | |
| SRP064894 | PTAR1 | 375743 | RNAseq | 0.0398 | 0.8862 | |
| SRP133303 | PTAR1 | 375743 | RNAseq | -0.1112 | 0.4397 | |
| SRP159526 | PTAR1 | 375743 | RNAseq | 0.2104 | 0.6848 | |
| SRP193095 | PTAR1 | 375743 | RNAseq | -0.0811 | 0.4640 | |
| SRP219564 | PTAR1 | 375743 | RNAseq | -0.3924 | 0.1972 | |
| TCGA | PTAR1 | 375743 | RNAseq | -0.1023 | 0.0636 |
Upregulated datasets: 0; Downregulated datasets: 1.
Survival by PTAR1 expression:
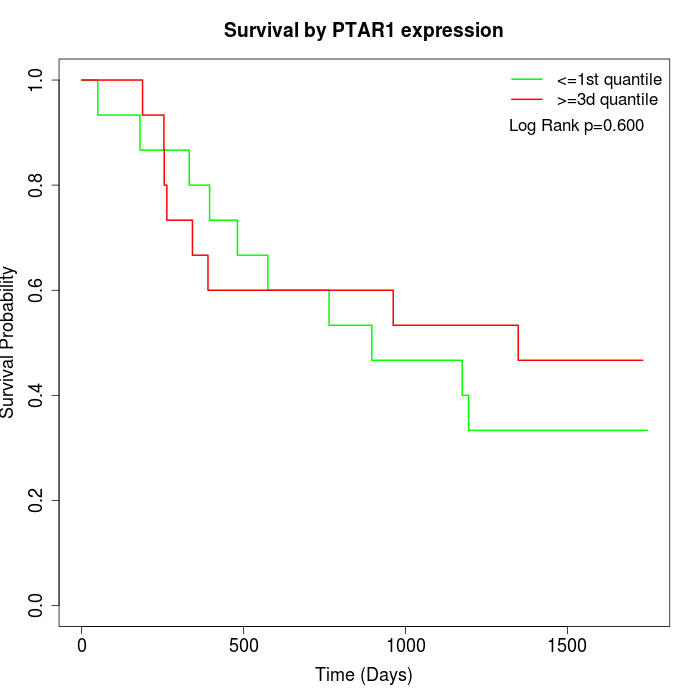 | 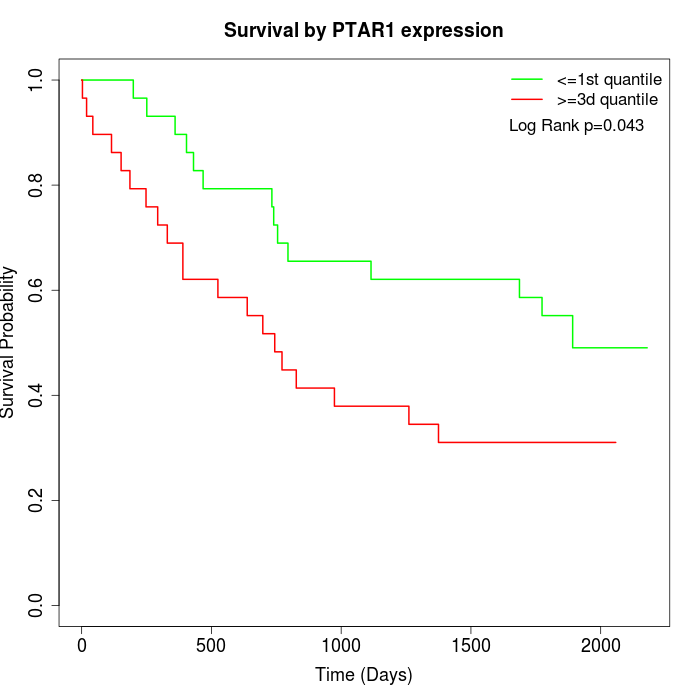 | 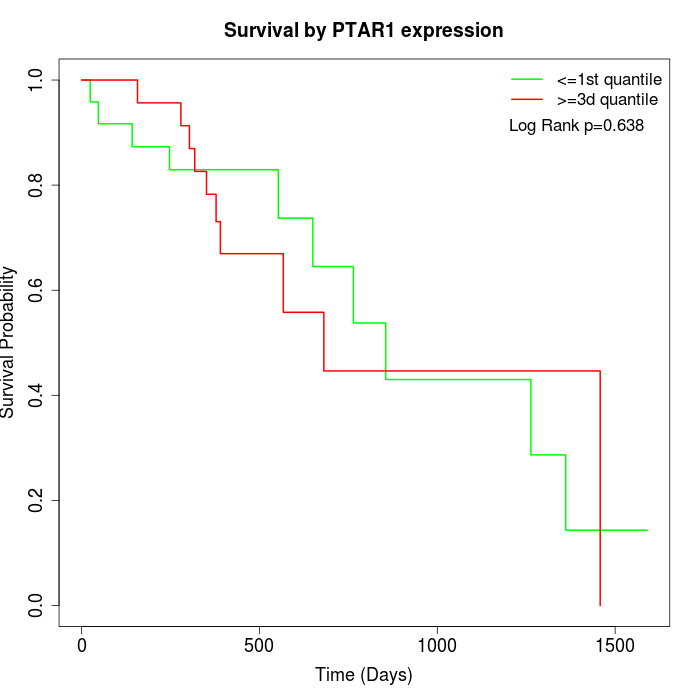 |
| GSE53622 | GSE53624 | TCGA |
Note: Click image to view full size file.
Copy number change of PTAR1:
| Dataset | Gene | EntrezID | Gain | Loss | Normal | Detail |
|---|---|---|---|---|---|---|
| GSE15526 | PTAR1 | 375743 | 6 | 10 | 14 | |
| GSE20123 | PTAR1 | 375743 | 6 | 10 | 14 | |
| GSE43470 | PTAR1 | 375743 | 6 | 5 | 32 | |
| GSE46452 | PTAR1 | 375743 | 6 | 14 | 39 | |
| GSE47630 | PTAR1 | 375743 | 1 | 19 | 20 | |
| GSE54993 | PTAR1 | 375743 | 5 | 1 | 64 | |
| GSE54994 | PTAR1 | 375743 | 4 | 13 | 36 | |
| GSE60625 | PTAR1 | 375743 | 0 | 0 | 11 | |
| GSE74703 | PTAR1 | 375743 | 5 | 4 | 27 | |
| GSE74704 | PTAR1 | 375743 | 3 | 7 | 10 | |
| TCGA | PTAR1 | 375743 | 19 | 28 | 49 |
Total number of gains: 61; Total number of losses: 111; Total Number of normals: 316.
Somatic mutations of PTAR1:
Generating mutation plots.
Highly correlated genes for PTAR1:
Showing top 20/445 corelated genes with mean PCC>0.5.
| Gene1 | Gene2 | Mean PCC | Num. Datasets | Num. PCC<0 | Num. PCC>0.5 |
|---|---|---|---|---|---|
| PTAR1 | RSAD1 | 0.844326 | 3 | 0 | 3 |
| PTAR1 | GALNT11 | 0.802759 | 3 | 0 | 3 |
| PTAR1 | FAM120B | 0.799841 | 3 | 0 | 3 |
| PTAR1 | ZMAT1 | 0.750832 | 3 | 0 | 3 |
| PTAR1 | MTRF1L | 0.742065 | 3 | 0 | 3 |
| PTAR1 | SRSF4 | 0.739001 | 4 | 0 | 4 |
| PTAR1 | WDR13 | 0.737185 | 3 | 0 | 3 |
| PTAR1 | NIN | 0.736169 | 3 | 0 | 3 |
| PTAR1 | GABBR1 | 0.733918 | 3 | 0 | 3 |
| PTAR1 | SAMD8 | 0.723533 | 3 | 0 | 3 |
| PTAR1 | ZMPSTE24 | 0.722433 | 3 | 0 | 3 |
| PTAR1 | ST6GALNAC6 | 0.721115 | 4 | 0 | 4 |
| PTAR1 | WASL | 0.714573 | 3 | 0 | 3 |
| PTAR1 | ZNF44 | 0.713776 | 4 | 0 | 4 |
| PTAR1 | UFL1 | 0.712797 | 4 | 0 | 3 |
| PTAR1 | THAP1 | 0.712623 | 4 | 0 | 4 |
| PTAR1 | ELF2 | 0.712132 | 5 | 0 | 4 |
| PTAR1 | LENG8 | 0.710449 | 3 | 0 | 3 |
| PTAR1 | MAN1A1 | 0.710257 | 3 | 0 | 3 |
| PTAR1 | RABGAP1 | 0.708666 | 5 | 0 | 5 |
For details and further investigation, click here