| Full name: progestagen associated endometrial protein | Alias Symbol: PEP|PP14|GdA|GdS|GdF|PAEG|GD|MGC138509|MGC142288 | ||
| Type: protein-coding gene | Cytoband: 9q34.3 | ||
| Entrez ID: 5047 | HGNC ID: HGNC:8573 | Ensembl Gene: ENSG00000122133 | OMIM ID: 173310 |
| Related drugs: CYPROTERONE ACETATE, GENISTEIN... [more] | |||
Expression of PAEP:
| Dataset | Gene | EntrezID | Probe | Log2FC | Adj.pValue | Expression |
|---|---|---|---|---|---|---|
| GSE17351 | PAEP | 5047 | 206859_s_at | 0.0459 | 0.8797 | |
| GSE20347 | PAEP | 5047 | 206859_s_at | 0.0089 | 0.9196 | |
| GSE23400 | PAEP | 5047 | 206859_s_at | -0.0959 | 0.0129 | |
| GSE26886 | PAEP | 5047 | 206859_s_at | 0.0879 | 0.5069 | |
| GSE29001 | PAEP | 5047 | 206859_s_at | -0.1213 | 0.3037 | |
| GSE38129 | PAEP | 5047 | 206859_s_at | -0.0421 | 0.5913 | |
| GSE45670 | PAEP | 5047 | 206859_s_at | 0.2928 | 0.0868 | |
| GSE53622 | PAEP | 5047 | 51192 | 0.3399 | 0.0000 | |
| GSE53624 | PAEP | 5047 | 51192 | 0.4854 | 0.0004 | |
| GSE63941 | PAEP | 5047 | 206859_s_at | 0.3299 | 0.7442 | |
| GSE77861 | PAEP | 5047 | 206859_s_at | -0.0901 | 0.2112 | |
| GSE97050 | PAEP | 5047 | A_33_P3364240 | 0.5920 | 0.1585 | |
| TCGA | PAEP | 5047 | RNAseq | 5.3594 | 0.0000 |
Upregulated datasets: 1; Downregulated datasets: 0.
Survival by PAEP expression:
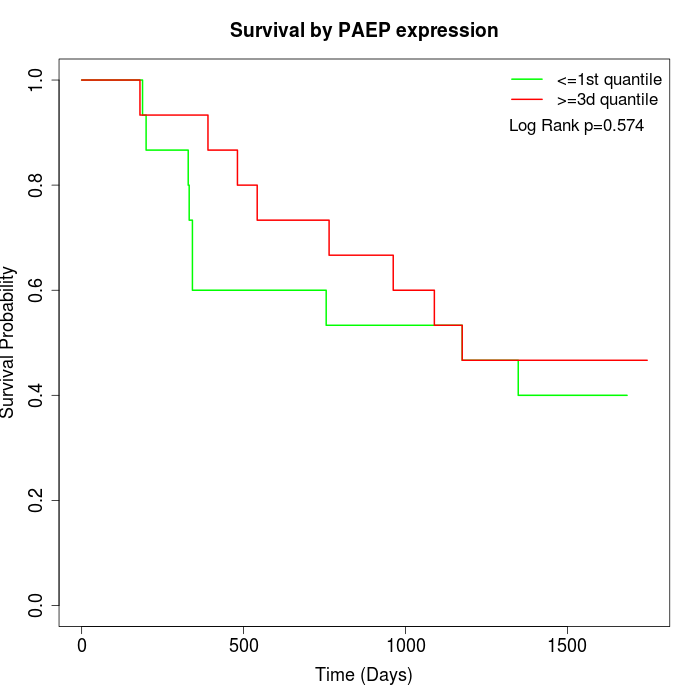 | 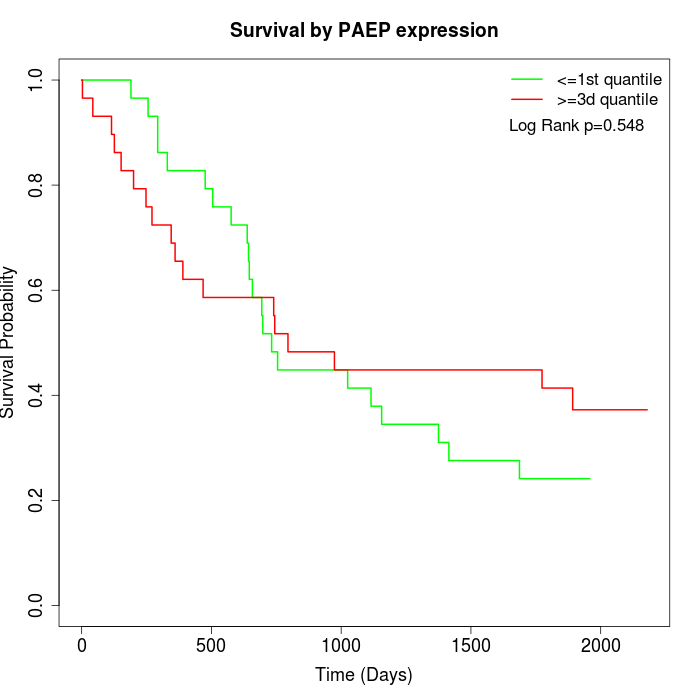 | 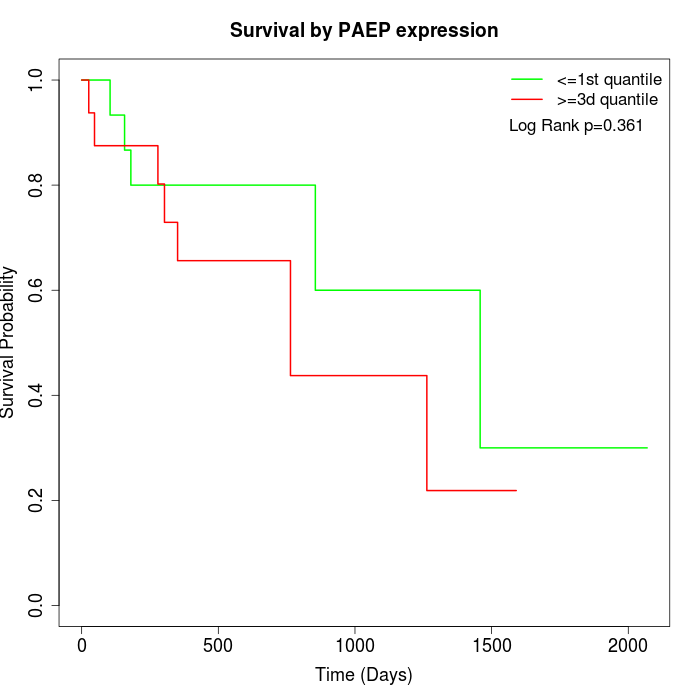 |
| GSE53622 | GSE53624 | TCGA |
Note: Click image to view full size file.
Copy number change of PAEP:
| Dataset | Gene | EntrezID | Gain | Loss | Normal | Detail |
|---|---|---|---|---|---|---|
| GSE15526 | PAEP | 5047 | 4 | 7 | 19 | |
| GSE20123 | PAEP | 5047 | 4 | 7 | 19 | |
| GSE43470 | PAEP | 5047 | 3 | 7 | 33 | |
| GSE46452 | PAEP | 5047 | 6 | 13 | 40 | |
| GSE47630 | PAEP | 5047 | 6 | 15 | 19 | |
| GSE54993 | PAEP | 5047 | 3 | 3 | 64 | |
| GSE54994 | PAEP | 5047 | 11 | 9 | 33 | |
| GSE60625 | PAEP | 5047 | 0 | 0 | 11 | |
| GSE74703 | PAEP | 5047 | 3 | 5 | 28 | |
| GSE74704 | PAEP | 5047 | 2 | 5 | 13 | |
| TCGA | PAEP | 5047 | 28 | 25 | 43 |
Total number of gains: 70; Total number of losses: 96; Total Number of normals: 322.
Somatic mutations of PAEP:
Generating mutation plots.
Highly correlated genes for PAEP:
Showing top 20/439 corelated genes with mean PCC>0.5.
| Gene1 | Gene2 | Mean PCC | Num. Datasets | Num. PCC<0 | Num. PCC>0.5 |
|---|---|---|---|---|---|
| PAEP | GRIK4 | 0.741771 | 3 | 0 | 3 |
| PAEP | MAGEA8 | 0.711106 | 4 | 0 | 4 |
| PAEP | GPR150 | 0.704313 | 3 | 0 | 3 |
| PAEP | SLC22A12 | 0.693807 | 4 | 0 | 4 |
| PAEP | GPR78 | 0.6919 | 3 | 0 | 3 |
| PAEP | SP8 | 0.687786 | 3 | 0 | 3 |
| PAEP | WDR38 | 0.680732 | 4 | 0 | 3 |
| PAEP | DCD | 0.680541 | 3 | 0 | 3 |
| PAEP | SMOC1 | 0.676345 | 5 | 0 | 4 |
| PAEP | CELA3B | 0.675099 | 3 | 0 | 3 |
| PAEP | PSMB11 | 0.674168 | 3 | 0 | 3 |
| PAEP | ZSWIM3 | 0.673417 | 3 | 0 | 3 |
| PAEP | SYCE3 | 0.672017 | 4 | 0 | 3 |
| PAEP | RASSF7 | 0.670871 | 5 | 0 | 4 |
| PAEP | TTLL9 | 0.66745 | 3 | 0 | 3 |
| PAEP | IFNA4 | 0.666348 | 3 | 0 | 3 |
| PAEP | FAM151A | 0.663336 | 3 | 0 | 3 |
| PAEP | TULP1 | 0.662594 | 3 | 0 | 3 |
| PAEP | HAO2 | 0.659682 | 3 | 0 | 3 |
| PAEP | FAM71F1 | 0.659149 | 3 | 0 | 3 |
For details and further investigation, click here