| Full name: glutamate ionotropic receptor kainate type subunit 4 | Alias Symbol: GluK4|KA1 | ||
| Type: protein-coding gene | Cytoband: 11q23.3 | ||
| Entrez ID: 2900 | HGNC ID: HGNC:4582 | Ensembl Gene: ENSG00000149403 | OMIM ID: 600282 |
| Related drugs: 2S,4R-4-METHYLGLUTAMATE, DOMOIC ACID, DYSIHERBAINE, KAINIC ACID, MESALAMINE, Selurampanel, TEZAMPANEL, TOPIRAMATE... [more] | |||
GRIK4 involved pathways:
| KEGG pathway | Description | View |
|---|---|---|
| hsa04724 | Glutamatergic synapse |
Expression of GRIK4:
| Dataset | Gene | EntrezID | Probe | Log2FC | Adj.pValue | Expression |
|---|---|---|---|---|---|---|
| GSE17351 | GRIK4 | 2900 | 208552_at | 0.1445 | 0.5961 | |
| GSE20347 | GRIK4 | 2900 | 208552_at | 0.0266 | 0.6877 | |
| GSE23400 | GRIK4 | 2900 | 208552_at | -0.0636 | 0.0080 | |
| GSE29001 | GRIK4 | 2900 | 208552_at | -0.0238 | 0.8198 | |
| GSE38129 | GRIK4 | 2900 | 208552_at | -0.0577 | 0.4261 | |
| GSE53622 | GRIK4 | 2900 | 67860 | 0.0616 | 0.4052 | |
| GSE53624 | GRIK4 | 2900 | 67860 | 0.0632 | 0.4830 | |
| GSE97050 | GRIK4 | 2900 | A_33_P3280074 | -0.1108 | 0.6410 | |
| SRP133303 | GRIK4 | 2900 | RNAseq | -2.2976 | 0.0000 | |
| SRP159526 | GRIK4 | 2900 | RNAseq | 0.4788 | 0.4211 | |
| TCGA | GRIK4 | 2900 | RNAseq | -0.5833 | 0.4060 |
Upregulated datasets: 0; Downregulated datasets: 1.
Survival by GRIK4 expression:
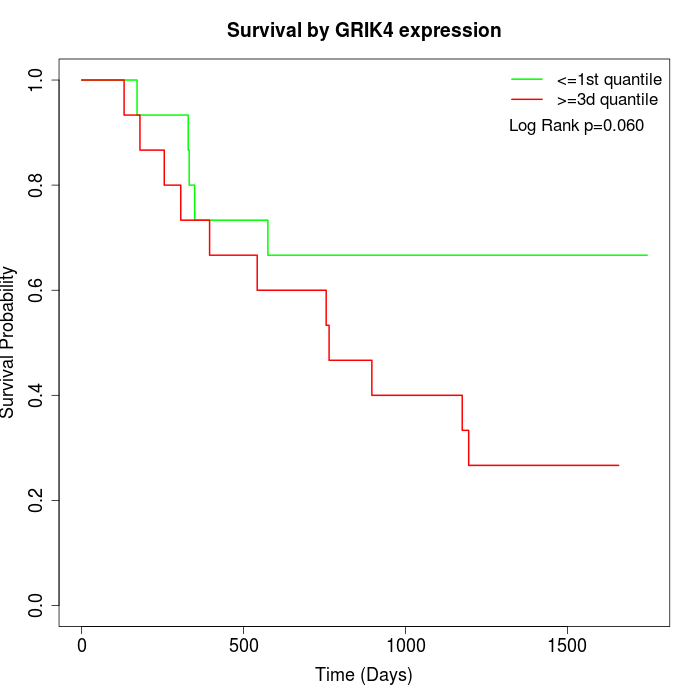 | 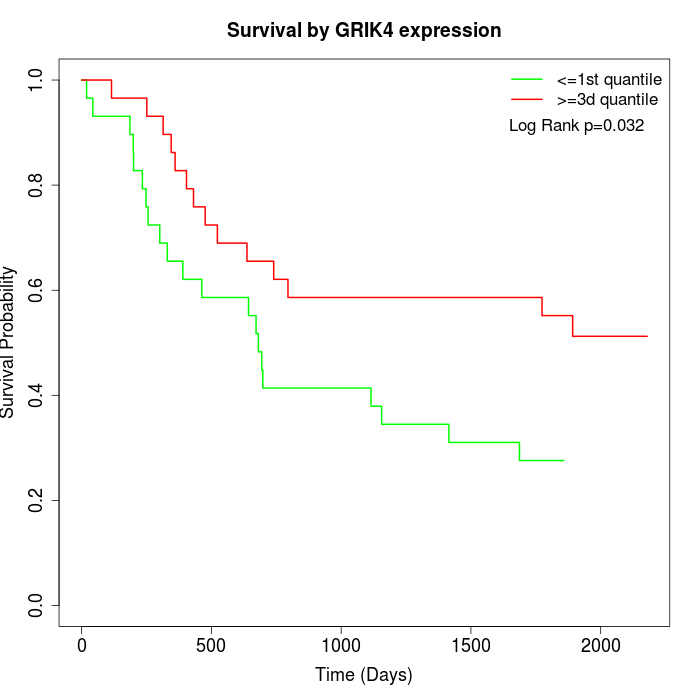 | 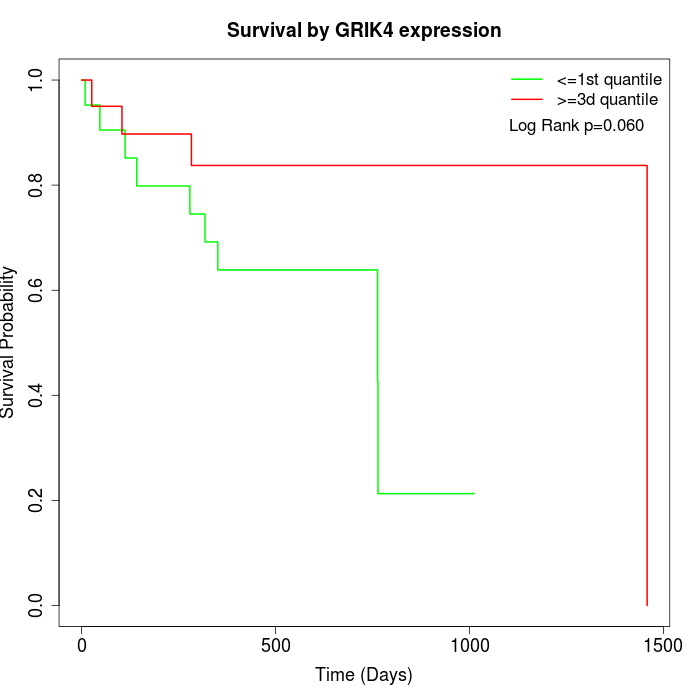 |
| GSE53622 | GSE53624 | TCGA |
Note: Click image to view full size file.
Copy number change of GRIK4:
| Dataset | Gene | EntrezID | Gain | Loss | Normal | Detail |
|---|---|---|---|---|---|---|
| GSE15526 | GRIK4 | 2900 | 1 | 13 | 16 | |
| GSE20123 | GRIK4 | 2900 | 1 | 13 | 16 | |
| GSE43470 | GRIK4 | 2900 | 2 | 8 | 33 | |
| GSE46452 | GRIK4 | 2900 | 3 | 26 | 30 | |
| GSE47630 | GRIK4 | 2900 | 2 | 19 | 19 | |
| GSE54993 | GRIK4 | 2900 | 10 | 0 | 60 | |
| GSE54994 | GRIK4 | 2900 | 5 | 19 | 29 | |
| GSE60625 | GRIK4 | 2900 | 0 | 3 | 8 | |
| GSE74703 | GRIK4 | 2900 | 1 | 5 | 30 | |
| GSE74704 | GRIK4 | 2900 | 0 | 9 | 11 | |
| TCGA | GRIK4 | 2900 | 5 | 50 | 41 |
Total number of gains: 30; Total number of losses: 165; Total Number of normals: 293.
Somatic mutations of GRIK4:
Generating mutation plots.
Highly correlated genes for GRIK4:
Showing top 20/488 corelated genes with mean PCC>0.5.
| Gene1 | Gene2 | Mean PCC | Num. Datasets | Num. PCC<0 | Num. PCC>0.5 |
|---|---|---|---|---|---|
| GRIK4 | STRC | 0.910454 | 3 | 0 | 3 |
| GRIK4 | FBRSL1 | 0.896603 | 3 | 0 | 3 |
| GRIK4 | SPACA3 | 0.895008 | 3 | 0 | 3 |
| GRIK4 | CLTCL1 | 0.882137 | 3 | 0 | 3 |
| GRIK4 | SLC22A31 | 0.876101 | 3 | 0 | 3 |
| GRIK4 | WDR87 | 0.866097 | 3 | 0 | 3 |
| GRIK4 | CIB3 | 0.860726 | 3 | 0 | 3 |
| GRIK4 | RNF180 | 0.8606 | 3 | 0 | 3 |
| GRIK4 | TRIM10 | 0.860205 | 3 | 0 | 3 |
| GRIK4 | KIRREL2 | 0.858037 | 3 | 0 | 3 |
| GRIK4 | DCDC1 | 0.853046 | 3 | 0 | 3 |
| GRIK4 | SHISA7 | 0.852301 | 3 | 0 | 3 |
| GRIK4 | CELF5 | 0.850124 | 3 | 0 | 3 |
| GRIK4 | PAX6 | 0.848382 | 3 | 0 | 3 |
| GRIK4 | PLA2G2C | 0.845482 | 3 | 0 | 3 |
| GRIK4 | ZNF527 | 0.844448 | 3 | 0 | 3 |
| GRIK4 | FFAR1 | 0.8432 | 3 | 0 | 3 |
| GRIK4 | TCTE1 | 0.841339 | 3 | 0 | 3 |
| GRIK4 | KCP | 0.837074 | 3 | 0 | 3 |
| GRIK4 | YY2 | 0.835687 | 3 | 0 | 3 |
For details and further investigation, click here