| Full name: phosphodiesterase 3A | Alias Symbol: CGI-PDE | ||
| Type: protein-coding gene | Cytoband: 12p12.2 | ||
| Entrez ID: 5139 | HGNC ID: HGNC:8778 | Ensembl Gene: ENSG00000172572 | OMIM ID: 123805 |
| Related drugs: AMINOPHYLLINE, ANAGRELIDE, ANAGRELIDE HYDROCHLORIDE, CHEMBL395336, CILOSTAMIDE, CILOSTAZOL, DIPYRIDAMOLE, DYPHYLLINE, ENOXIMONE, IBUDILAST... [more] | |||
PDE3A involved pathways:
| KEGG pathway | Description | View |
|---|---|---|
| hsa04022 | cGMP-PKG signaling pathway | |
| hsa04024 | cAMP signaling pathway | |
| hsa04924 | Renin secretion |
Expression of PDE3A:
| Dataset | Gene | EntrezID | Probe | Log2FC | Adj.pValue | Expression |
|---|---|---|---|---|---|---|
| GSE17351 | PDE3A | 5139 | 228507_at | -0.8655 | 0.5526 | |
| GSE20347 | PDE3A | 5139 | 206388_at | -0.0260 | 0.7198 | |
| GSE23400 | PDE3A | 5139 | 206388_at | -0.1290 | 0.0226 | |
| GSE26886 | PDE3A | 5139 | 206388_at | 0.1254 | 0.3126 | |
| GSE29001 | PDE3A | 5139 | 206388_at | 0.0036 | 0.9832 | |
| GSE38129 | PDE3A | 5139 | 206388_at | -0.1732 | 0.0230 | |
| GSE45670 | PDE3A | 5139 | 228507_at | -1.8042 | 0.0001 | |
| GSE53622 | PDE3A | 5139 | 92715 | -0.3670 | 0.0410 | |
| GSE53624 | PDE3A | 5139 | 92715 | 0.0085 | 0.9519 | |
| GSE63941 | PDE3A | 5139 | 206388_at | -0.1482 | 0.5199 | |
| GSE77861 | PDE3A | 5139 | 206388_at | -0.1155 | 0.4402 | |
| GSE97050 | PDE3A | 5139 | A_23_P60837 | -0.4276 | 0.3309 | |
| SRP007169 | PDE3A | 5139 | RNAseq | 2.8764 | 0.0000 | |
| SRP064894 | PDE3A | 5139 | RNAseq | 0.6564 | 0.0823 | |
| SRP133303 | PDE3A | 5139 | RNAseq | -0.9543 | 0.0001 | |
| SRP159526 | PDE3A | 5139 | RNAseq | -0.0633 | 0.8881 | |
| SRP193095 | PDE3A | 5139 | RNAseq | 1.3605 | 0.0000 | |
| TCGA | PDE3A | 5139 | RNAseq | -0.5521 | 0.0361 |
Upregulated datasets: 2; Downregulated datasets: 1.
Survival by PDE3A expression:
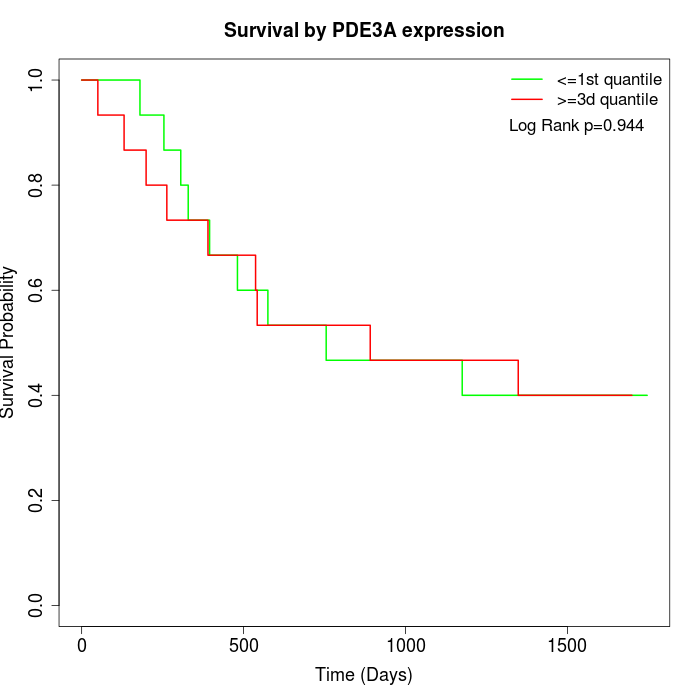 | 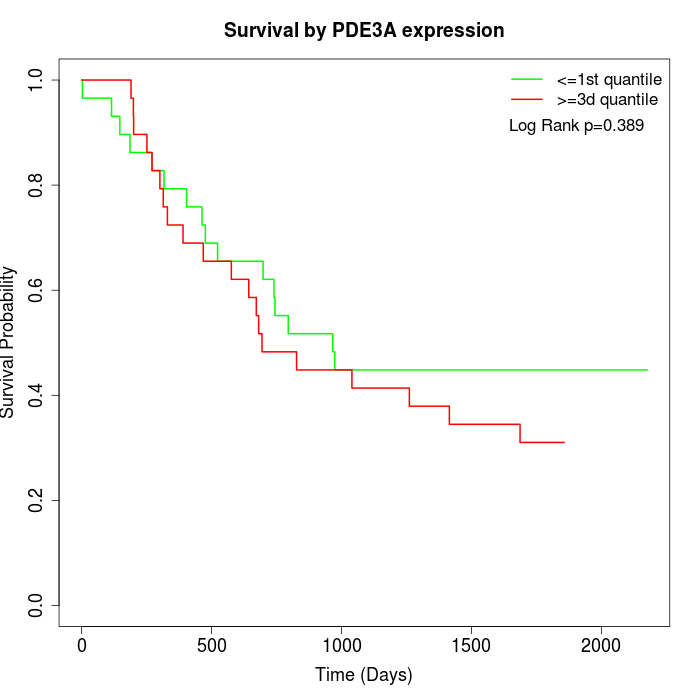 | 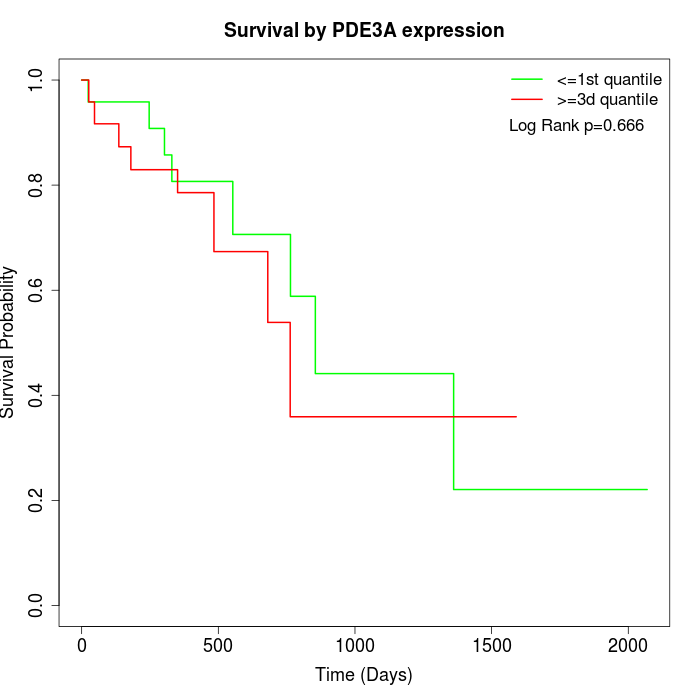 |
| GSE53622 | GSE53624 | TCGA |
Note: Click image to view full size file.
Copy number change of PDE3A:
| Dataset | Gene | EntrezID | Gain | Loss | Normal | Detail |
|---|---|---|---|---|---|---|
| GSE15526 | PDE3A | 5139 | 9 | 2 | 19 | |
| GSE20123 | PDE3A | 5139 | 9 | 2 | 19 | |
| GSE43470 | PDE3A | 5139 | 9 | 4 | 30 | |
| GSE46452 | PDE3A | 5139 | 10 | 1 | 48 | |
| GSE47630 | PDE3A | 5139 | 14 | 1 | 25 | |
| GSE54993 | PDE3A | 5139 | 1 | 9 | 60 | |
| GSE54994 | PDE3A | 5139 | 12 | 2 | 39 | |
| GSE60625 | PDE3A | 5139 | 0 | 1 | 10 | |
| GSE74703 | PDE3A | 5139 | 9 | 3 | 24 | |
| GSE74704 | PDE3A | 5139 | 6 | 1 | 13 | |
| TCGA | PDE3A | 5139 | 42 | 5 | 49 |
Total number of gains: 121; Total number of losses: 31; Total Number of normals: 336.
Somatic mutations of PDE3A:
Generating mutation plots.
Highly correlated genes for PDE3A:
Showing top 20/927 corelated genes with mean PCC>0.5.
| Gene1 | Gene2 | Mean PCC | Num. Datasets | Num. PCC<0 | Num. PCC>0.5 |
|---|---|---|---|---|---|
| PDE3A | RBM24 | 0.768112 | 5 | 0 | 5 |
| PDE3A | CYS1 | 0.759175 | 5 | 0 | 5 |
| PDE3A | ZNF653 | 0.756908 | 3 | 0 | 3 |
| PDE3A | LRCH2 | 0.753083 | 5 | 0 | 5 |
| PDE3A | STARD13 | 0.748195 | 6 | 0 | 6 |
| PDE3A | MYOCD | 0.747697 | 4 | 0 | 4 |
| PDE3A | ANTXR2 | 0.739333 | 5 | 0 | 5 |
| PDE3A | FNDC5 | 0.736472 | 4 | 0 | 3 |
| PDE3A | FOXF2 | 0.733957 | 6 | 0 | 6 |
| PDE3A | GIPC3 | 0.731853 | 4 | 0 | 4 |
| PDE3A | SLC35F1 | 0.727484 | 4 | 0 | 3 |
| PDE3A | TCEAL7 | 0.718953 | 4 | 0 | 4 |
| PDE3A | LIN37 | 0.718366 | 3 | 0 | 3 |
| PDE3A | CHADL | 0.717953 | 3 | 0 | 3 |
| PDE3A | MRGPRF | 0.717821 | 6 | 0 | 5 |
| PDE3A | MTURN | 0.716496 | 5 | 0 | 5 |
| PDE3A | MYOT | 0.716018 | 6 | 0 | 6 |
| PDE3A | CCDC136 | 0.714386 | 5 | 0 | 4 |
| PDE3A | KCNMB1 | 0.713795 | 6 | 0 | 5 |
| PDE3A | FOXF1 | 0.71366 | 6 | 0 | 6 |
For details and further investigation, click here