| Full name: potassium calcium-activated channel subfamily M regulatory beta subunit 1 | Alias Symbol: hslo-beta | ||
| Type: protein-coding gene | Cytoband: 5q35.1 | ||
| Entrez ID: 3779 | HGNC ID: HGNC:6285 | Ensembl Gene: ENSG00000145936 | OMIM ID: 603951 |
| Drug and gene relationship at DGIdb | |||
KCNMB1 involved pathways:
| KEGG pathway | Description | View |
|---|---|---|
| hsa04022 | cGMP-PKG signaling pathway | |
| hsa04270 | Vascular smooth muscle contraction |
Expression of KCNMB1:
| Dataset | Gene | EntrezID | Probe | Log2FC | Adj.pValue | Expression |
|---|---|---|---|---|---|---|
| GSE17351 | KCNMB1 | 3779 | 209948_at | -1.9567 | 0.2189 | |
| GSE20347 | KCNMB1 | 3779 | 209948_at | -0.3627 | 0.3454 | |
| GSE23400 | KCNMB1 | 3779 | 209948_at | -0.7673 | 0.0004 | |
| GSE26886 | KCNMB1 | 3779 | 209948_at | -0.1833 | 0.5761 | |
| GSE29001 | KCNMB1 | 3779 | 209948_at | -0.1751 | 0.6559 | |
| GSE38129 | KCNMB1 | 3779 | 209948_at | -1.1728 | 0.0221 | |
| GSE45670 | KCNMB1 | 3779 | 209948_at | -2.4994 | 0.0000 | |
| GSE53622 | KCNMB1 | 3779 | 732 | -1.6809 | 0.0000 | |
| GSE53624 | KCNMB1 | 3779 | 732 | -1.6608 | 0.0000 | |
| GSE63941 | KCNMB1 | 3779 | 209948_at | 0.3330 | 0.0719 | |
| GSE77861 | KCNMB1 | 3779 | 209948_at | 0.0810 | 0.7153 | |
| GSE97050 | KCNMB1 | 3779 | A_24_P206121 | -1.1045 | 0.1711 | |
| SRP007169 | KCNMB1 | 3779 | RNAseq | 0.1965 | 0.7381 | |
| SRP064894 | KCNMB1 | 3779 | RNAseq | -0.3226 | 0.4531 | |
| SRP133303 | KCNMB1 | 3779 | RNAseq | -0.5456 | 0.2013 | |
| SRP193095 | KCNMB1 | 3779 | RNAseq | 0.1274 | 0.3049 | |
| SRP219564 | KCNMB1 | 3779 | RNAseq | -1.0338 | 0.3843 | |
| TCGA | KCNMB1 | 3779 | RNAseq | -0.8072 | 0.0002 |
Upregulated datasets: 0; Downregulated datasets: 4.
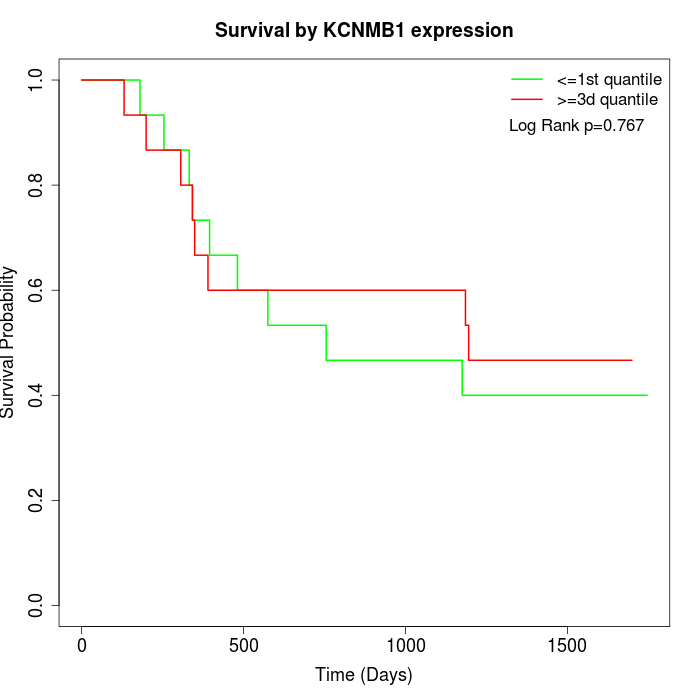
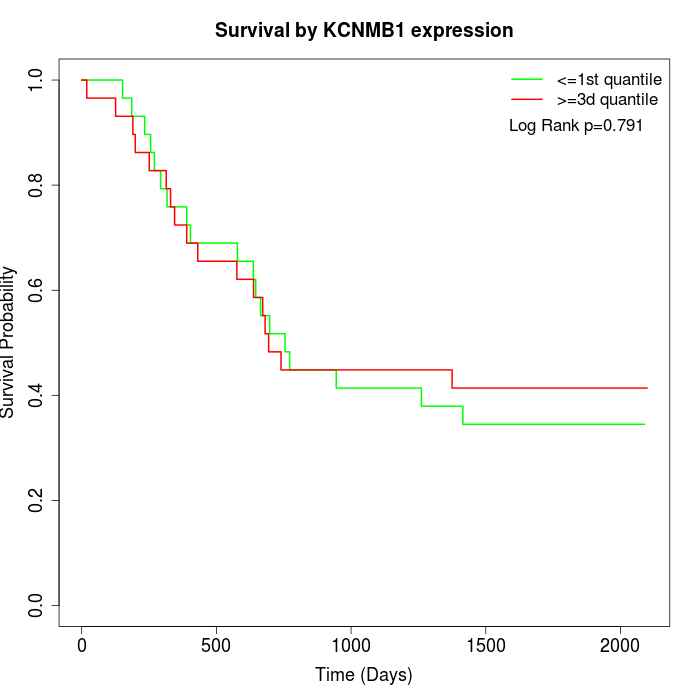
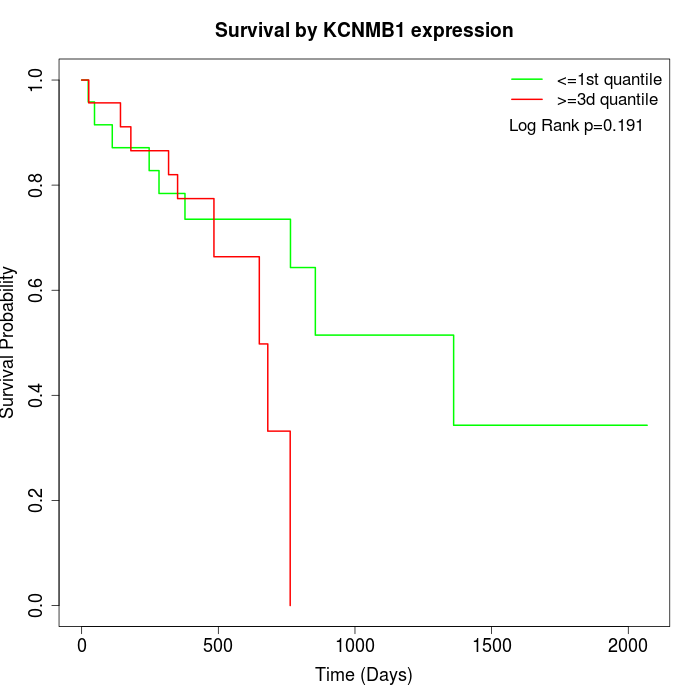
Survival by KCNMB1 expression:
Note: Click image to view full size file.
Copy number change of KCNMB1:
| Dataset | Gene | EntrezID | Gain | Loss | Normal | Detail |
|---|---|---|---|---|---|---|
| GSE15526 | KCNMB1 | 3779 | 1 | 13 | 16 | |
| GSE20123 | KCNMB1 | 3779 | 1 | 13 | 16 | |
| GSE43470 | KCNMB1 | 3779 | 1 | 9 | 33 | |
| GSE46452 | KCNMB1 | 3779 | 0 | 27 | 32 | |
| GSE47630 | KCNMB1 | 3779 | 0 | 20 | 20 | |
| GSE54993 | KCNMB1 | 3779 | 9 | 2 | 59 | |
| GSE54994 | KCNMB1 | 3779 | 2 | 15 | 36 | |
| GSE60625 | KCNMB1 | 3779 | 1 | 0 | 10 | |
| GSE74703 | KCNMB1 | 3779 | 1 | 6 | 29 | |
| GSE74704 | KCNMB1 | 3779 | 0 | 6 | 14 | |
| TCGA | KCNMB1 | 3779 | 7 | 36 | 53 |
Total number of gains: 23; Total number of losses: 147; Total Number of normals: 318.
Somatic mutations of KCNMB1:
Generating mutation plots.
Highly correlated genes for KCNMB1:
Showing top 20/769 corelated genes with mean PCC>0.5.
| Gene1 | Gene2 | Mean PCC | Num. Datasets | Num. PCC<0 | Num. PCC>0.5 |
|---|---|---|---|---|---|
| KCNMB1 | SORCS1 | 0.860535 | 4 | 0 | 4 |
| KCNMB1 | CHRDL1 | 0.845653 | 9 | 0 | 9 |
| KCNMB1 | XKR4 | 0.835618 | 5 | 0 | 5 |
| KCNMB1 | ITGA7 | 0.829785 | 11 | 0 | 11 |
| KCNMB1 | CYP21A2 | 0.822074 | 3 | 0 | 3 |
| KCNMB1 | PDZRN4 | 0.820774 | 9 | 0 | 9 |
| KCNMB1 | RAB9B | 0.819535 | 6 | 0 | 6 |
| KCNMB1 | MYOM1 | 0.81785 | 10 | 0 | 10 |
| KCNMB1 | RBPMS2 | 0.817083 | 8 | 0 | 8 |
| KCNMB1 | PPP1R12B | 0.812929 | 11 | 0 | 11 |
| KCNMB1 | MYL5 | 0.805648 | 3 | 0 | 3 |
| KCNMB1 | CASQ2 | 0.805236 | 12 | 0 | 12 |
| KCNMB1 | ANGPTL1 | 0.805086 | 6 | 0 | 6 |
| KCNMB1 | SYNM | 0.795136 | 12 | 0 | 11 |
| KCNMB1 | FILIP1 | 0.792758 | 5 | 0 | 5 |
| KCNMB1 | A2M-AS1 | 0.792415 | 3 | 0 | 3 |
| KCNMB1 | SGCA | 0.789323 | 10 | 0 | 9 |
| KCNMB1 | KCNT2 | 0.789212 | 5 | 0 | 5 |
| KCNMB1 | SH3BGR | 0.787919 | 9 | 0 | 9 |
| KCNMB1 | ACTBL2 | 0.778919 | 3 | 0 | 3 |
For details and further investigation, click here


