| Full name: maturin, neural progenitor differentiation regulator homolog | Alias Symbol: FLJ25903|Ells1 | ||
| Type: protein-coding gene | Cytoband: 7p14.3 | ||
| Entrez ID: 222166 | HGNC ID: HGNC:25457 | Ensembl Gene: ENSG00000180354 | OMIM ID: |
Expression of MTURN:
| Dataset | Gene | EntrezID | Probe | Log2FC | Adj.pValue | Expression |
|---|---|---|---|---|---|---|
| GSE17351 | MTURN | 222166 | 226018_at | -1.4712 | 0.2229 | |
| GSE26886 | MTURN | 222166 | 227000_at | 0.0575 | 0.7291 | |
| GSE45670 | MTURN | 222166 | 226018_at | -1.9410 | 0.0000 | |
| GSE53622 | MTURN | 222166 | 113388 | -1.4067 | 0.0000 | |
| GSE53624 | MTURN | 222166 | 116104 | -0.9390 | 0.0000 | |
| GSE63941 | MTURN | 222166 | 226018_at | -1.6174 | 0.0390 | |
| GSE77861 | MTURN | 222166 | 227000_at | -0.1099 | 0.3536 | |
| SRP007169 | MTURN | 222166 | RNAseq | -0.3507 | 0.4605 | |
| SRP008496 | MTURN | 222166 | RNAseq | 0.3123 | 0.4412 | |
| SRP064894 | MTURN | 222166 | RNAseq | -0.6534 | 0.0042 | |
| SRP133303 | MTURN | 222166 | RNAseq | -0.1836 | 0.6691 | |
| SRP159526 | MTURN | 222166 | RNAseq | -1.0560 | 0.0001 | |
| SRP193095 | MTURN | 222166 | RNAseq | -0.4929 | 0.0079 | |
| SRP219564 | MTURN | 222166 | RNAseq | -1.0793 | 0.1478 |
Upregulated datasets: 0; Downregulated datasets: 4.
Survival by MTURN expression:
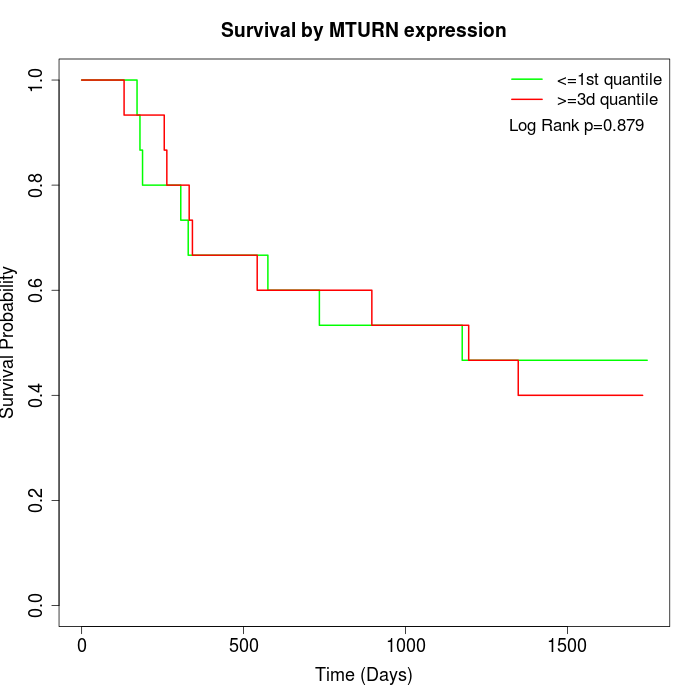 | 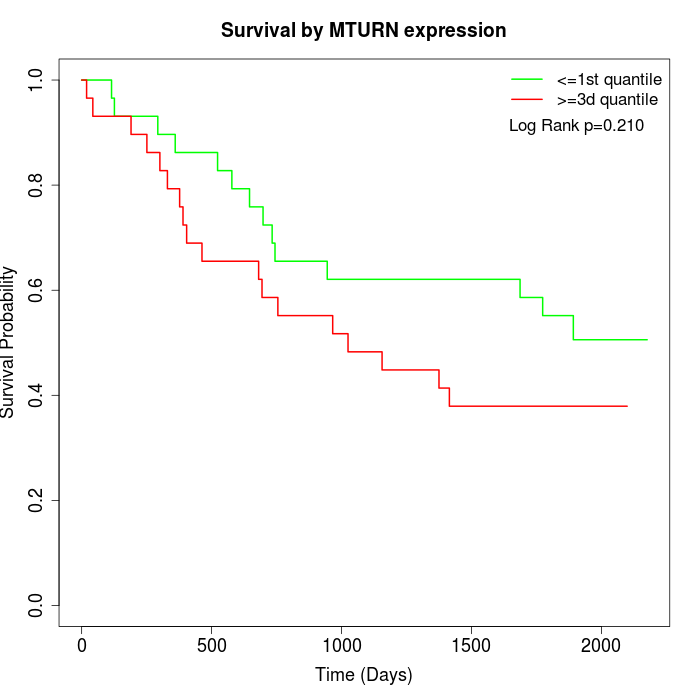 |
| GSE53622 | GSE53624 |
Note: Click image to view full size file.
Copy number change of MTURN:
| Dataset | Gene | EntrezID | Gain | Loss | Normal | Detail |
|---|---|---|---|---|---|---|
| GSE15526 | MTURN | 222166 | 16 | 0 | 14 | |
| GSE20123 | MTURN | 222166 | 16 | 0 | 14 | |
| GSE43470 | MTURN | 222166 | 4 | 0 | 39 | |
| GSE46452 | MTURN | 222166 | 11 | 1 | 47 | |
| GSE47630 | MTURN | 222166 | 8 | 1 | 31 | |
| GSE54993 | MTURN | 222166 | 0 | 6 | 64 | |
| GSE54994 | MTURN | 222166 | 19 | 3 | 31 | |
| GSE60625 | MTURN | 222166 | 0 | 0 | 11 | |
| GSE74703 | MTURN | 222166 | 4 | 0 | 32 | |
| GSE74704 | MTURN | 222166 | 10 | 0 | 10 |
Total number of gains: 88; Total number of losses: 11; Total Number of normals: 293.
Somatic mutations of MTURN:
Generating mutation plots.
Highly correlated genes for MTURN:
Showing top 20/586 corelated genes with mean PCC>0.5.
| Gene1 | Gene2 | Mean PCC | Num. Datasets | Num. PCC<0 | Num. PCC>0.5 |
|---|---|---|---|---|---|
| MTURN | DTNA | 0.832061 | 3 | 0 | 3 |
| MTURN | CASQ2 | 0.823644 | 4 | 0 | 4 |
| MTURN | JPH2 | 0.811183 | 3 | 0 | 3 |
| MTURN | NCAM1 | 0.799357 | 4 | 0 | 4 |
| MTURN | ADAMTSL1 | 0.789734 | 4 | 0 | 4 |
| MTURN | MYOC | 0.778956 | 4 | 0 | 4 |
| MTURN | MAMDC2 | 0.778924 | 4 | 0 | 4 |
| MTURN | CBX7 | 0.775005 | 4 | 0 | 4 |
| MTURN | ITGA7 | 0.76955 | 4 | 0 | 4 |
| MTURN | SLMAP | 0.764732 | 4 | 0 | 4 |
| MTURN | KCNQ4 | 0.760357 | 3 | 0 | 3 |
| MTURN | GIPC3 | 0.75972 | 3 | 0 | 3 |
| MTURN | TSPAN2 | 0.759108 | 4 | 0 | 4 |
| MTURN | RBPMS | 0.758274 | 3 | 0 | 3 |
| MTURN | SLC2A13 | 0.7528 | 3 | 0 | 3 |
| MTURN | ZBTB16 | 0.751937 | 3 | 0 | 3 |
| MTURN | PCP4 | 0.748437 | 4 | 0 | 4 |
| MTURN | KCNMA1 | 0.741884 | 4 | 0 | 4 |
| MTURN | ITGA9 | 0.736383 | 4 | 0 | 4 |
| MTURN | TCEAL1 | 0.73569 | 4 | 0 | 4 |
For details and further investigation, click here