| Full name: retinal outer segment membrane protein 1 | Alias Symbol: TSPAN23|ROM | ||
| Type: protein-coding gene | Cytoband: 11q13 | ||
| Entrez ID: 6094 | HGNC ID: HGNC:10254 | Ensembl Gene: ENSG00000149489 | OMIM ID: 180721 |
Expression of ROM1:
| Dataset | Gene | EntrezID | Probe | Log2FC | Adj.pValue | Expression |
|---|---|---|---|---|---|---|
| GSE17351 | ROM1 | 6094 | 205806_at | -0.5024 | 0.0695 | |
| GSE20347 | ROM1 | 6094 | 205806_at | -0.2732 | 0.0017 | |
| GSE23400 | ROM1 | 6094 | 205806_at | -0.2154 | 0.0000 | |
| GSE26886 | ROM1 | 6094 | 205806_at | -0.0980 | 0.6180 | |
| GSE29001 | ROM1 | 6094 | 205806_at | -0.4006 | 0.0246 | |
| GSE38129 | ROM1 | 6094 | 205806_at | -0.3180 | 0.0001 | |
| GSE45670 | ROM1 | 6094 | 205806_at | -0.3464 | 0.0029 | |
| GSE53622 | ROM1 | 6094 | 19525 | 0.1641 | 0.0797 | |
| GSE53624 | ROM1 | 6094 | 19525 | 0.1642 | 0.0711 | |
| GSE63941 | ROM1 | 6094 | 205806_at | -0.3214 | 0.1609 | |
| GSE77861 | ROM1 | 6094 | 205806_at | -0.2526 | 0.2307 | |
| GSE97050 | ROM1 | 6094 | A_23_P105002 | -0.2519 | 0.2666 | |
| SRP007169 | ROM1 | 6094 | RNAseq | -2.1935 | 0.0000 | |
| SRP064894 | ROM1 | 6094 | RNAseq | -0.7988 | 0.0052 | |
| SRP133303 | ROM1 | 6094 | RNAseq | -0.4692 | 0.0738 | |
| SRP159526 | ROM1 | 6094 | RNAseq | -0.5745 | 0.0827 | |
| SRP219564 | ROM1 | 6094 | RNAseq | -0.8782 | 0.1259 | |
| TCGA | ROM1 | 6094 | RNAseq | -0.3486 | 0.0085 |
Upregulated datasets: 0; Downregulated datasets: 1.
Survival by ROM1 expression:
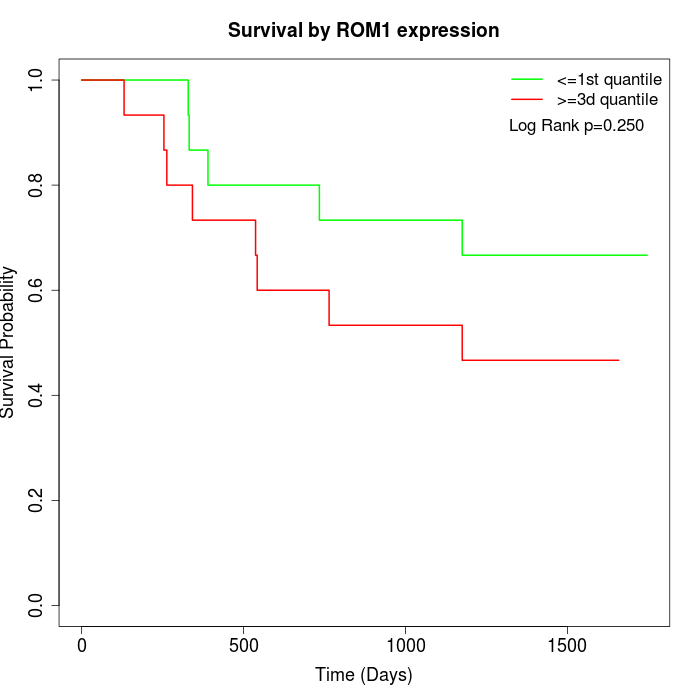 | 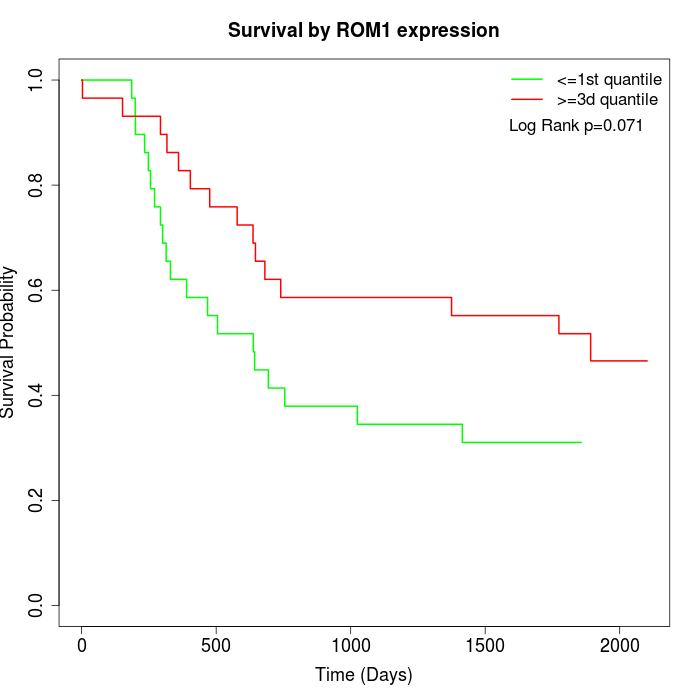 | 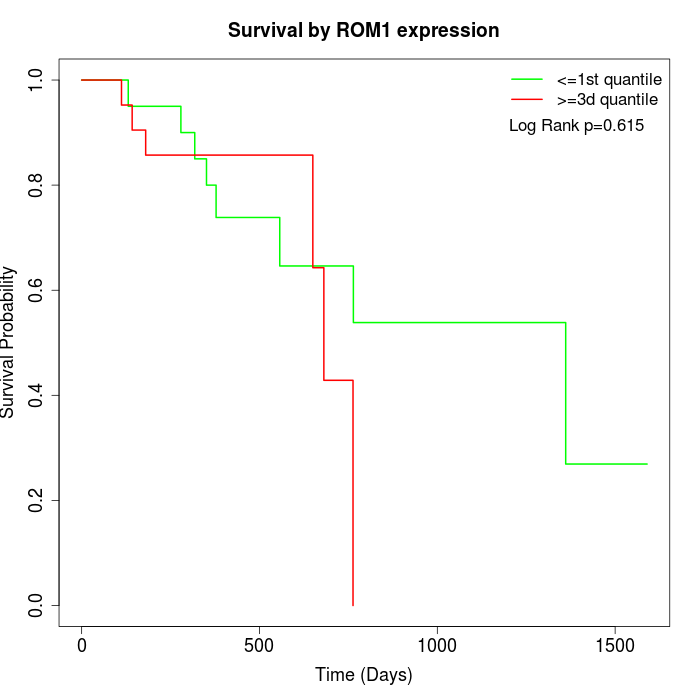 |
| GSE53622 | GSE53624 | TCGA |
Note: Click image to view full size file.
Copy number change of ROM1:
| Dataset | Gene | EntrezID | Gain | Loss | Normal | Detail |
|---|---|---|---|---|---|---|
| GSE15526 | ROM1 | 6094 | 6 | 5 | 19 | |
| GSE20123 | ROM1 | 6094 | 6 | 5 | 19 | |
| GSE43470 | ROM1 | 6094 | 1 | 6 | 36 | |
| GSE46452 | ROM1 | 6094 | 8 | 4 | 47 | |
| GSE47630 | ROM1 | 6094 | 3 | 7 | 30 | |
| GSE54993 | ROM1 | 6094 | 3 | 0 | 67 | |
| GSE54994 | ROM1 | 6094 | 4 | 5 | 44 | |
| GSE60625 | ROM1 | 6094 | 0 | 3 | 8 | |
| GSE74703 | ROM1 | 6094 | 1 | 3 | 32 | |
| GSE74704 | ROM1 | 6094 | 4 | 3 | 13 | |
| TCGA | ROM1 | 6094 | 14 | 11 | 71 |
Total number of gains: 50; Total number of losses: 52; Total Number of normals: 386.
Somatic mutations of ROM1:
Generating mutation plots.
Highly correlated genes for ROM1:
Showing top 20/948 corelated genes with mean PCC>0.5.
| Gene1 | Gene2 | Mean PCC | Num. Datasets | Num. PCC<0 | Num. PCC>0.5 |
|---|---|---|---|---|---|
| ROM1 | RBM43 | 0.829645 | 3 | 0 | 3 |
| ROM1 | PRSS38 | 0.824391 | 3 | 0 | 3 |
| ROM1 | YY2 | 0.815207 | 3 | 0 | 3 |
| ROM1 | OR2T27 | 0.791389 | 3 | 0 | 3 |
| ROM1 | OTOG | 0.782708 | 3 | 0 | 3 |
| ROM1 | OR2A5 | 0.778445 | 3 | 0 | 3 |
| ROM1 | TMEM179 | 0.777052 | 3 | 0 | 3 |
| ROM1 | OR2T1 | 0.775646 | 3 | 0 | 3 |
| ROM1 | C20orf173 | 0.770744 | 4 | 0 | 4 |
| ROM1 | PRAMEF5 | 0.763353 | 3 | 0 | 3 |
| ROM1 | KRTAP10-12 | 0.763076 | 3 | 0 | 3 |
| ROM1 | PLA2G2C | 0.752103 | 3 | 0 | 3 |
| ROM1 | OR2D2 | 0.751565 | 3 | 0 | 3 |
| ROM1 | KLF17 | 0.747976 | 3 | 0 | 3 |
| ROM1 | TFE3 | 0.745524 | 4 | 0 | 4 |
| ROM1 | KRTAP2-1 | 0.741881 | 3 | 0 | 3 |
| ROM1 | TTLL9 | 0.740618 | 5 | 0 | 5 |
| ROM1 | OR7G2 | 0.740488 | 3 | 0 | 3 |
| ROM1 | C1QL2 | 0.7389 | 3 | 0 | 3 |
| ROM1 | TMEM235 | 0.737664 | 3 | 0 | 3 |
For details and further investigation, click here