| Full name: SEC14 like lipid binding 3 | Alias Symbol: TAP2 | ||
| Type: protein-coding gene | Cytoband: 22q12.2 | ||
| Entrez ID: 266629 | HGNC ID: HGNC:18655 | Ensembl Gene: ENSG00000100012 | OMIM ID: 612824 |
Expression of SEC14L3:
| Dataset | Gene | EntrezID | Probe | Log2FC | Adj.pValue | Expression |
|---|---|---|---|---|---|---|
| GSE17351 | SEC14L3 | 266629 | 241221_at | 0.0653 | 0.8264 | |
| GSE20347 | SEC14L3 | 266629 | 216346_at | -0.1751 | 0.0026 | |
| GSE23400 | SEC14L3 | 266629 | 216346_at | -0.2178 | 0.0000 | |
| GSE26886 | SEC14L3 | 266629 | 241221_at | 0.2057 | 0.1231 | |
| GSE29001 | SEC14L3 | 266629 | 216346_at | -0.2537 | 0.0403 | |
| GSE38129 | SEC14L3 | 266629 | 216346_at | -0.1715 | 0.0015 | |
| GSE45670 | SEC14L3 | 266629 | 241221_at | 0.1192 | 0.2097 | |
| GSE53622 | SEC14L3 | 266629 | 31264 | -0.1643 | 0.0214 | |
| GSE53624 | SEC14L3 | 266629 | 31264 | -0.2772 | 0.0004 | |
| GSE63941 | SEC14L3 | 266629 | 241221_at | 0.1320 | 0.4137 | |
| GSE77861 | SEC14L3 | 266629 | 240699_at | -0.2397 | 0.0938 | |
| GSE97050 | SEC14L3 | 266629 | A_33_P3383551 | -0.1957 | 0.3038 |
Upregulated datasets: 0; Downregulated datasets: 0.
Survival by SEC14L3 expression:
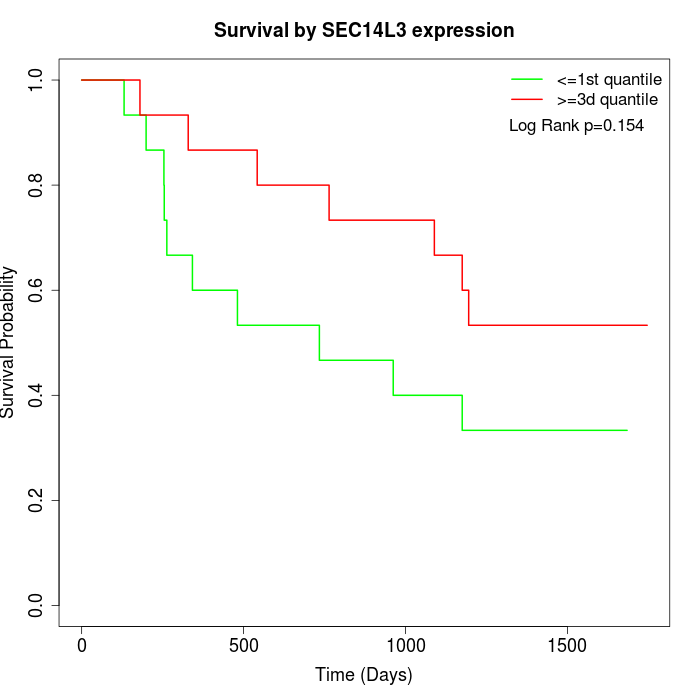 | 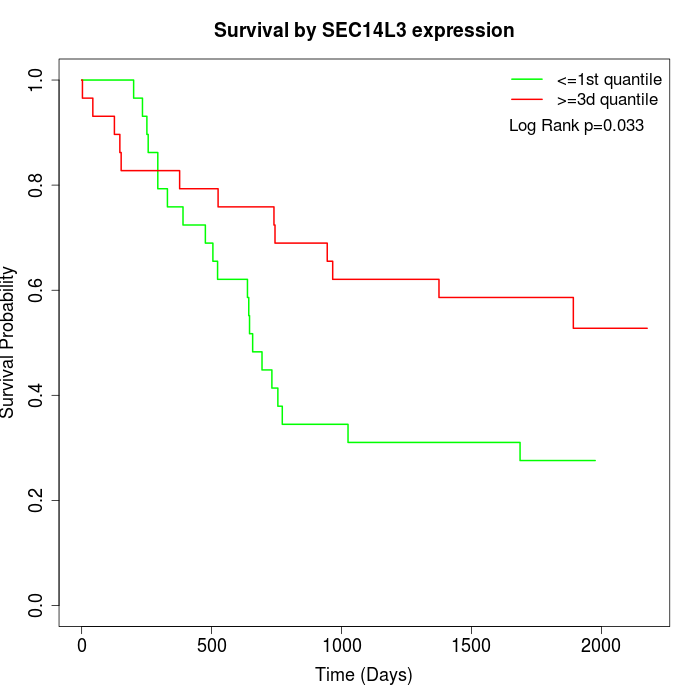 | 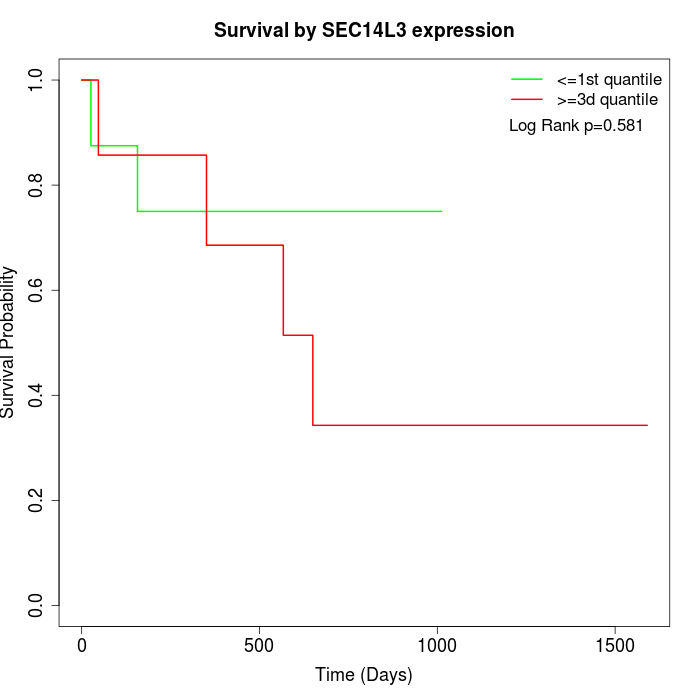 |
| GSE53622 | GSE53624 | TCGA |
Note: Click image to view full size file.
Copy number change of SEC14L3:
| Dataset | Gene | EntrezID | Gain | Loss | Normal | Detail |
|---|---|---|---|---|---|---|
| GSE15526 | SEC14L3 | 266629 | 4 | 5 | 21 | |
| GSE20123 | SEC14L3 | 266629 | 4 | 4 | 22 | |
| GSE43470 | SEC14L3 | 266629 | 4 | 6 | 33 | |
| GSE46452 | SEC14L3 | 266629 | 31 | 1 | 27 | |
| GSE47630 | SEC14L3 | 266629 | 8 | 5 | 27 | |
| GSE54993 | SEC14L3 | 266629 | 3 | 6 | 61 | |
| GSE54994 | SEC14L3 | 266629 | 11 | 8 | 34 | |
| GSE60625 | SEC14L3 | 266629 | 5 | 0 | 6 | |
| GSE74703 | SEC14L3 | 266629 | 4 | 5 | 27 | |
| GSE74704 | SEC14L3 | 266629 | 1 | 1 | 18 | |
| TCGA | SEC14L3 | 266629 | 27 | 15 | 54 |
Total number of gains: 102; Total number of losses: 56; Total Number of normals: 330.
Somatic mutations of SEC14L3:
Generating mutation plots.
Highly correlated genes for SEC14L3:
Showing top 20/584 corelated genes with mean PCC>0.5.
| Gene1 | Gene2 | Mean PCC | Num. Datasets | Num. PCC<0 | Num. PCC>0.5 |
|---|---|---|---|---|---|
| SEC14L3 | CCDC166 | 0.741143 | 3 | 0 | 3 |
| SEC14L3 | TMEM217 | 0.738969 | 4 | 0 | 4 |
| SEC14L3 | NLRP5 | 0.736933 | 3 | 0 | 3 |
| SEC14L3 | ZNF182 | 0.736721 | 3 | 0 | 3 |
| SEC14L3 | PADI6 | 0.724593 | 3 | 0 | 3 |
| SEC14L3 | APOA1 | 0.720708 | 4 | 0 | 4 |
| SEC14L3 | SKAP1 | 0.71855 | 3 | 0 | 3 |
| SEC14L3 | ALDH1L1 | 0.71791 | 3 | 0 | 3 |
| SEC14L3 | CCKBR | 0.710031 | 4 | 0 | 4 |
| SEC14L3 | OR1F1 | 0.70941 | 4 | 0 | 4 |
| SEC14L3 | WDR78 | 0.707743 | 3 | 0 | 3 |
| SEC14L3 | LYPD4 | 0.704209 | 3 | 0 | 3 |
| SEC14L3 | LRRC72 | 0.698299 | 3 | 0 | 3 |
| SEC14L3 | MAGEA8 | 0.698048 | 3 | 0 | 3 |
| SEC14L3 | PPP1R3F | 0.693886 | 4 | 0 | 3 |
| SEC14L3 | RHBG | 0.691261 | 6 | 0 | 5 |
| SEC14L3 | C19orf73 | 0.691204 | 4 | 0 | 3 |
| SEC14L3 | CEND1 | 0.68123 | 3 | 0 | 3 |
| SEC14L3 | BCAN | 0.680673 | 3 | 0 | 3 |
| SEC14L3 | ACSM5 | 0.679859 | 4 | 0 | 4 |
For details and further investigation, click here