| Full name: cell cycle exit and neuronal differentiation 1 | Alias Symbol: FLJ90066|BM88 | ||
| Type: protein-coding gene | Cytoband: 11p15.5 | ||
| Entrez ID: 51286 | HGNC ID: HGNC:24153 | Ensembl Gene: ENSG00000184524 | OMIM ID: 608213 |
Screen Evidence:
| |||
Expression of CEND1:
| Dataset | Gene | EntrezID | Probe | Log2FC | Adj.pValue | Expression |
|---|---|---|---|---|---|---|
| GSE17351 | CEND1 | 51286 | 219591_at | -0.0934 | 0.6712 | |
| GSE20347 | CEND1 | 51286 | 219591_at | 0.0172 | 0.8805 | |
| GSE23400 | CEND1 | 51286 | 219591_at | -0.1249 | 0.0013 | |
| GSE26886 | CEND1 | 51286 | 219591_at | -0.0187 | 0.9001 | |
| GSE29001 | CEND1 | 51286 | 219591_at | -0.1229 | 0.5169 | |
| GSE38129 | CEND1 | 51286 | 219591_at | -0.1548 | 0.1230 | |
| GSE45670 | CEND1 | 51286 | 219591_at | 0.0766 | 0.4701 | |
| GSE53622 | CEND1 | 51286 | 41802 | -0.1361 | 0.1006 | |
| GSE53624 | CEND1 | 51286 | 41802 | 0.1415 | 0.1516 | |
| GSE63941 | CEND1 | 51286 | 219591_at | -0.1446 | 0.3031 | |
| GSE77861 | CEND1 | 51286 | 219591_at | -0.0525 | 0.7017 | |
| GSE97050 | CEND1 | 51286 | A_33_P3323945 | -0.3034 | 0.3631 | |
| SRP133303 | CEND1 | 51286 | RNAseq | -0.2280 | 0.4312 | |
| SRP219564 | CEND1 | 51286 | RNAseq | -1.2627 | 0.2371 | |
| TCGA | CEND1 | 51286 | RNAseq | -0.2828 | 0.4984 |
Upregulated datasets: 0; Downregulated datasets: 0.
Survival by CEND1 expression:
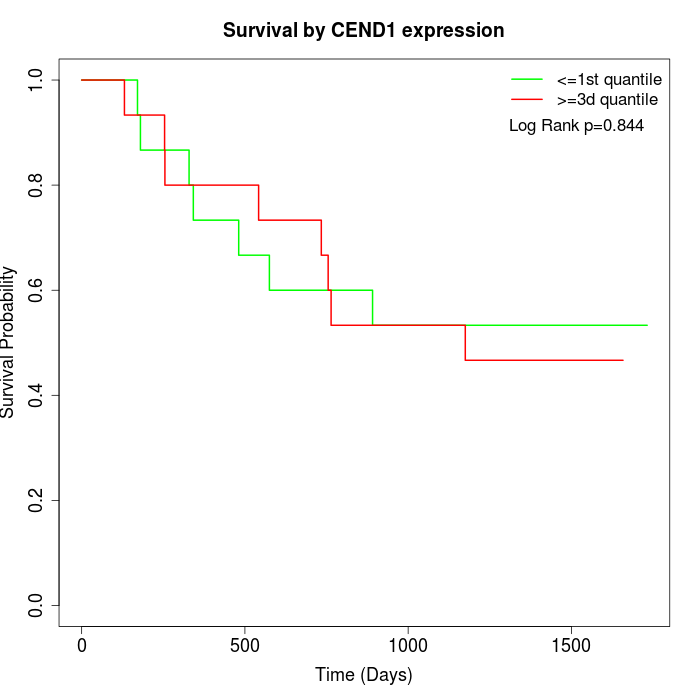 |  |  |
| GSE53622 | GSE53624 | TCGA |
Note: Click image to view full size file.
Copy number change of CEND1:
| Dataset | Gene | EntrezID | Gain | Loss | Normal | Detail |
|---|---|---|---|---|---|---|
| GSE15526 | CEND1 | 51286 | 1 | 11 | 18 | |
| GSE20123 | CEND1 | 51286 | 1 | 12 | 17 | |
| GSE43470 | CEND1 | 51286 | 1 | 10 | 32 | |
| GSE46452 | CEND1 | 51286 | 7 | 8 | 44 | |
| GSE47630 | CEND1 | 51286 | 4 | 12 | 24 | |
| GSE54993 | CEND1 | 51286 | 3 | 1 | 66 | |
| GSE54994 | CEND1 | 51286 | 1 | 12 | 40 | |
| GSE60625 | CEND1 | 51286 | 0 | 0 | 11 | |
| GSE74703 | CEND1 | 51286 | 1 | 8 | 27 | |
| GSE74704 | CEND1 | 51286 | 0 | 8 | 12 | |
| TCGA | CEND1 | 51286 | 8 | 38 | 50 |
Total number of gains: 27; Total number of losses: 120; Total Number of normals: 341.
Somatic mutations of CEND1:
Generating mutation plots.
Highly correlated genes for CEND1:
Showing top 20/1096 corelated genes with mean PCC>0.5.
| Gene1 | Gene2 | Mean PCC | Num. Datasets | Num. PCC<0 | Num. PCC>0.5 |
|---|---|---|---|---|---|
| CEND1 | OSBPL5 | 0.79029 | 3 | 0 | 3 |
| CEND1 | TCP10 | 0.749903 | 4 | 0 | 4 |
| CEND1 | C22orf23 | 0.747191 | 3 | 0 | 3 |
| CEND1 | TSKS | 0.739145 | 3 | 0 | 3 |
| CEND1 | BCL2L10 | 0.730628 | 4 | 0 | 4 |
| CEND1 | RGL4 | 0.71433 | 3 | 0 | 3 |
| CEND1 | PGC | 0.712725 | 5 | 0 | 5 |
| CEND1 | CD247 | 0.711972 | 3 | 0 | 3 |
| CEND1 | RNF123 | 0.706002 | 4 | 0 | 3 |
| CEND1 | MAPK8IP2 | 0.7047 | 6 | 0 | 6 |
| CEND1 | AMACR | 0.701062 | 4 | 0 | 4 |
| CEND1 | REG3A | 0.697968 | 4 | 0 | 3 |
| CEND1 | CDK20 | 0.693455 | 3 | 0 | 3 |
| CEND1 | CYP3A4 | 0.682447 | 5 | 0 | 4 |
| CEND1 | IGFALS | 0.682285 | 6 | 0 | 5 |
| CEND1 | PTGDR2 | 0.68216 | 4 | 0 | 3 |
| CEND1 | SEC14L3 | 0.68123 | 3 | 0 | 3 |
| CEND1 | NOG | 0.681065 | 3 | 0 | 3 |
| CEND1 | CYP2D6 | 0.680602 | 8 | 0 | 7 |
| CEND1 | S100A5 | 0.679859 | 6 | 0 | 6 |
For details and further investigation, click here