| Full name: solute carrier organic anion transporter family member 3A1 | Alias Symbol: OATP-D|OATP3A1 | ||
| Type: protein-coding gene | Cytoband: 15q26.1 | ||
| Entrez ID: 28232 | HGNC ID: HGNC:10952 | Ensembl Gene: ENSG00000176463 | OMIM ID: 612435 |
Expression of SLCO3A1:
| Dataset | Gene | EntrezID | Probe | Log2FC | Adj.pValue | Expression |
|---|---|---|---|---|---|---|
| GSE17351 | SLCO3A1 | 28232 | 219229_at | 0.0175 | 0.9886 | |
| GSE20347 | SLCO3A1 | 28232 | 219229_at | 0.6263 | 0.0139 | |
| GSE23400 | SLCO3A1 | 28232 | 210542_s_at | 0.0771 | 0.2426 | |
| GSE26886 | SLCO3A1 | 28232 | 219229_at | 1.7376 | 0.0000 | |
| GSE29001 | SLCO3A1 | 28232 | 219229_at | 0.4659 | 0.0843 | |
| GSE38129 | SLCO3A1 | 28232 | 219229_at | 0.7861 | 0.0013 | |
| GSE45670 | SLCO3A1 | 28232 | 219229_at | 0.3228 | 0.2611 | |
| GSE53622 | SLCO3A1 | 28232 | 142295 | 0.7282 | 0.0000 | |
| GSE53624 | SLCO3A1 | 28232 | 9073 | -0.0013 | 0.9896 | |
| GSE63941 | SLCO3A1 | 28232 | 227367_at | -1.2424 | 0.1165 | |
| GSE77861 | SLCO3A1 | 28232 | 227367_at | 0.6589 | 0.0712 | |
| GSE97050 | SLCO3A1 | 28232 | A_24_P336276 | 0.1899 | 0.5440 | |
| SRP007169 | SLCO3A1 | 28232 | RNAseq | 0.8082 | 0.0749 | |
| SRP008496 | SLCO3A1 | 28232 | RNAseq | 0.9550 | 0.0179 | |
| SRP064894 | SLCO3A1 | 28232 | RNAseq | 0.2187 | 0.2013 | |
| SRP133303 | SLCO3A1 | 28232 | RNAseq | -0.1173 | 0.6814 | |
| SRP159526 | SLCO3A1 | 28232 | RNAseq | 1.2121 | 0.0000 | |
| SRP193095 | SLCO3A1 | 28232 | RNAseq | 0.8057 | 0.0007 | |
| SRP219564 | SLCO3A1 | 28232 | RNAseq | -0.1517 | 0.6046 | |
| TCGA | SLCO3A1 | 28232 | RNAseq | 0.3916 | 0.0000 |
Upregulated datasets: 2; Downregulated datasets: 0.
Survival by SLCO3A1 expression:
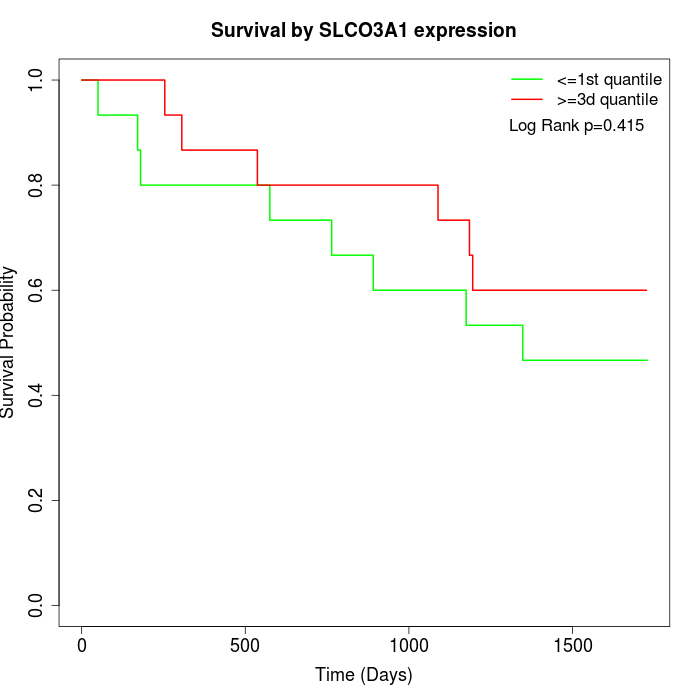 | 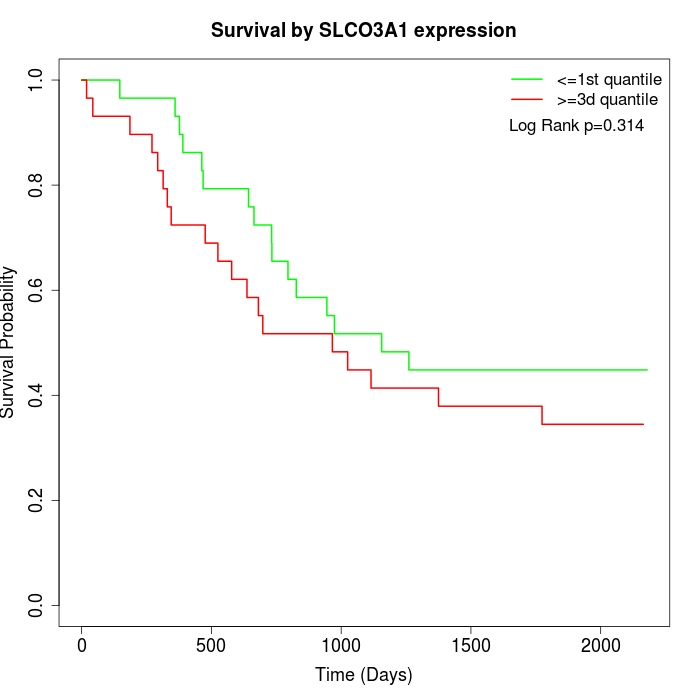 | 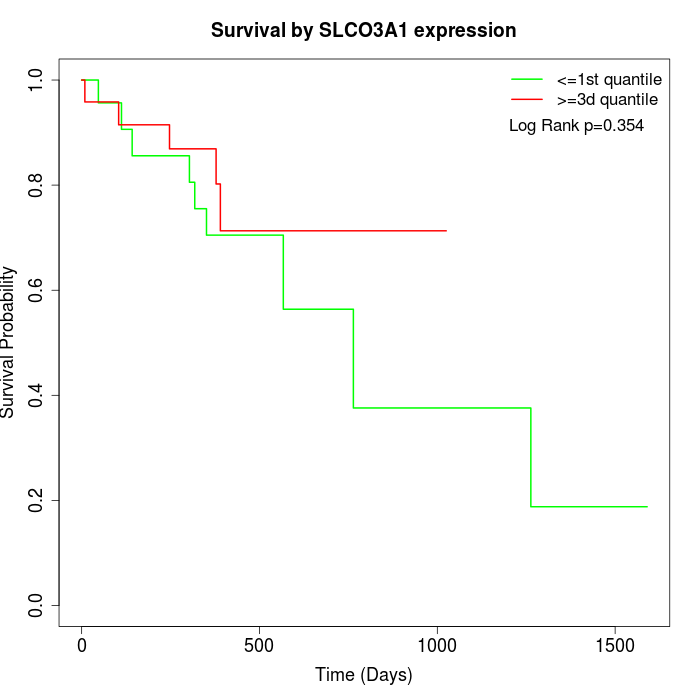 |
| GSE53622 | GSE53624 | TCGA |
Note: Click image to view full size file.
Copy number change of SLCO3A1:
| Dataset | Gene | EntrezID | Gain | Loss | Normal | Detail |
|---|---|---|---|---|---|---|
| GSE15526 | SLCO3A1 | 28232 | 7 | 2 | 21 | |
| GSE20123 | SLCO3A1 | 28232 | 7 | 2 | 21 | |
| GSE43470 | SLCO3A1 | 28232 | 5 | 4 | 34 | |
| GSE46452 | SLCO3A1 | 28232 | 3 | 7 | 49 | |
| GSE47630 | SLCO3A1 | 28232 | 8 | 11 | 21 | |
| GSE54993 | SLCO3A1 | 28232 | 4 | 6 | 60 | |
| GSE54994 | SLCO3A1 | 28232 | 7 | 7 | 39 | |
| GSE60625 | SLCO3A1 | 28232 | 4 | 0 | 7 | |
| GSE74703 | SLCO3A1 | 28232 | 4 | 3 | 29 | |
| GSE74704 | SLCO3A1 | 28232 | 3 | 3 | 14 | |
| TCGA | SLCO3A1 | 28232 | 19 | 13 | 64 |
Total number of gains: 71; Total number of losses: 58; Total Number of normals: 359.
Somatic mutations of SLCO3A1:
Generating mutation plots.
Highly correlated genes for SLCO3A1:
Showing top 20/709 corelated genes with mean PCC>0.5.
| Gene1 | Gene2 | Mean PCC | Num. Datasets | Num. PCC<0 | Num. PCC>0.5 |
|---|---|---|---|---|---|
| SLCO3A1 | RILPL2 | 0.889718 | 3 | 0 | 3 |
| SLCO3A1 | PIK3R3 | 0.853923 | 3 | 0 | 3 |
| SLCO3A1 | STON1 | 0.823195 | 3 | 0 | 3 |
| SLCO3A1 | RSF1 | 0.80717 | 3 | 0 | 3 |
| SLCO3A1 | SLC41A1 | 0.801346 | 3 | 0 | 3 |
| SLCO3A1 | HIBADH | 0.793279 | 3 | 0 | 3 |
| SLCO3A1 | PDLIM1 | 0.783561 | 3 | 0 | 3 |
| SLCO3A1 | EMILIN2 | 0.782912 | 3 | 0 | 3 |
| SLCO3A1 | TAF10 | 0.758636 | 3 | 0 | 3 |
| SLCO3A1 | APOO | 0.758261 | 3 | 0 | 3 |
| SLCO3A1 | HNRNPUL2 | 0.747261 | 3 | 0 | 3 |
| SLCO3A1 | EID2 | 0.745592 | 3 | 0 | 3 |
| SLCO3A1 | PDCD2L | 0.744484 | 3 | 0 | 3 |
| SLCO3A1 | ZSCAN29 | 0.738703 | 3 | 0 | 3 |
| SLCO3A1 | GNPAT | 0.737979 | 3 | 0 | 3 |
| SLCO3A1 | RFX7 | 0.736624 | 4 | 0 | 3 |
| SLCO3A1 | ZFYVE27 | 0.736054 | 3 | 0 | 3 |
| SLCO3A1 | PARVB | 0.735471 | 3 | 0 | 3 |
| SLCO3A1 | LSM10 | 0.734265 | 3 | 0 | 3 |
| SLCO3A1 | SACS | 0.733881 | 3 | 0 | 3 |
For details and further investigation, click here