| Full name: LSM10, U7 small nuclear RNA associated | Alias Symbol: MGC15749 | ||
| Type: protein-coding gene | Cytoband: 1p34.3 | ||
| Entrez ID: 84967 | HGNC ID: HGNC:17562 | Ensembl Gene: ENSG00000181817 | OMIM ID: 617909 |
Screen Evidence:
| |||
Expression of LSM10:
| Dataset | Gene | EntrezID | Probe | Log2FC | Adj.pValue | Expression |
|---|---|---|---|---|---|---|
| GSE17351 | LSM10 | 84967 | 225593_at | 0.5054 | 0.3403 | |
| GSE26886 | LSM10 | 84967 | 225593_at | 0.9992 | 0.0000 | |
| GSE45670 | LSM10 | 84967 | 225593_at | 0.2342 | 0.1581 | |
| GSE53622 | LSM10 | 84967 | 24957 | 0.3278 | 0.0000 | |
| GSE53624 | LSM10 | 84967 | 24957 | 0.5264 | 0.0000 | |
| GSE63941 | LSM10 | 84967 | 225593_at | -0.0365 | 0.9395 | |
| GSE77861 | LSM10 | 84967 | 225593_at | 0.3769 | 0.1379 | |
| GSE97050 | LSM10 | 84967 | A_24_P216681 | 0.1003 | 0.7903 | |
| SRP007169 | LSM10 | 84967 | RNAseq | 0.5050 | 0.1590 | |
| SRP008496 | LSM10 | 84967 | RNAseq | 0.2038 | 0.3805 | |
| SRP064894 | LSM10 | 84967 | RNAseq | 0.7330 | 0.0193 | |
| SRP133303 | LSM10 | 84967 | RNAseq | 0.5676 | 0.0002 | |
| SRP159526 | LSM10 | 84967 | RNAseq | 0.4862 | 0.0384 | |
| SRP193095 | LSM10 | 84967 | RNAseq | 0.2036 | 0.2966 | |
| SRP219564 | LSM10 | 84967 | RNAseq | -0.0022 | 0.9968 | |
| TCGA | LSM10 | 84967 | RNAseq | 0.0716 | 0.2390 |
Upregulated datasets: 0; Downregulated datasets: 0.
Survival by LSM10 expression:
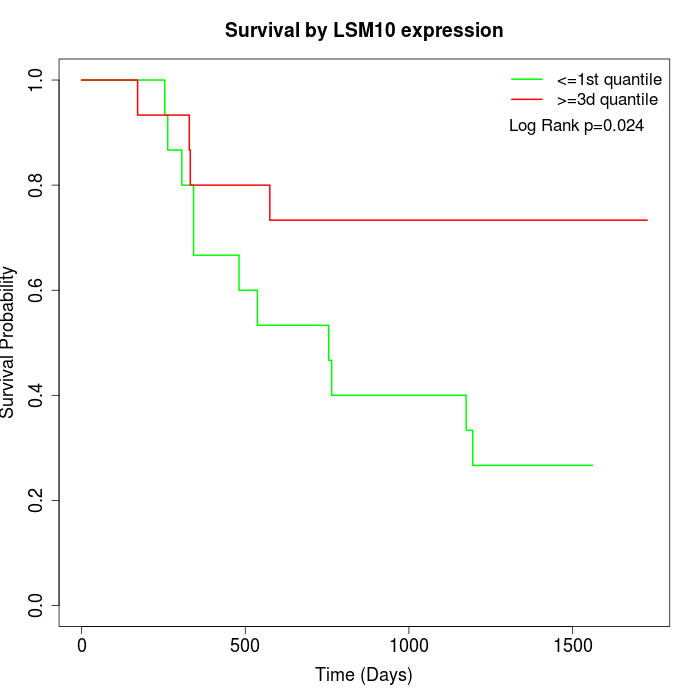 | 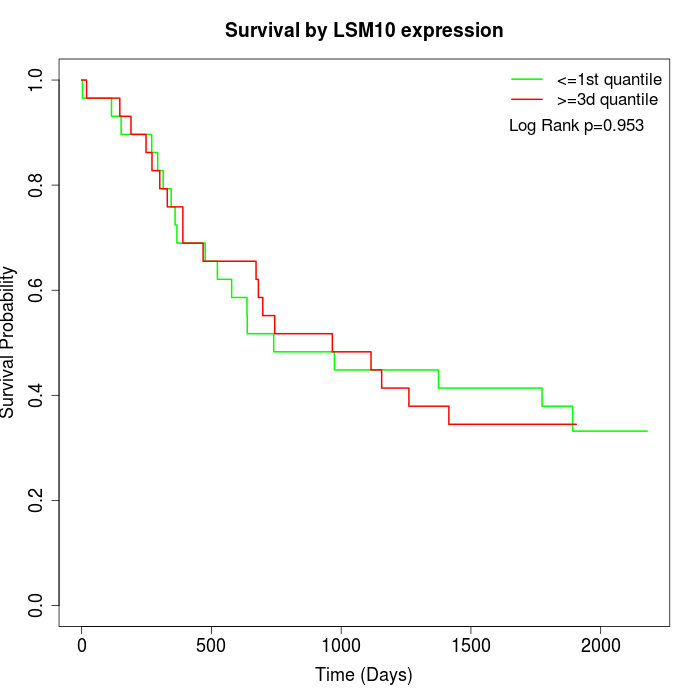 | 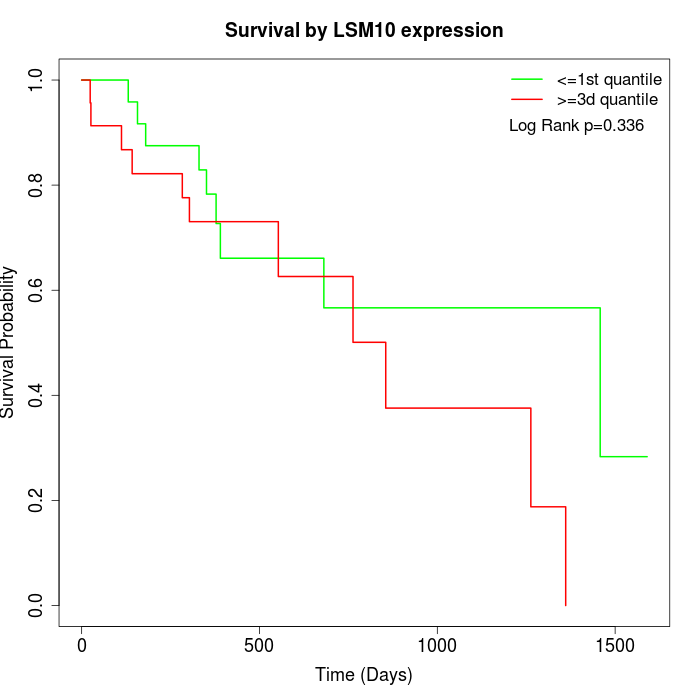 |
| GSE53622 | GSE53624 | TCGA |
Note: Click image to view full size file.
Copy number change of LSM10:
| Dataset | Gene | EntrezID | Gain | Loss | Normal | Detail |
|---|---|---|---|---|---|---|
| GSE15526 | LSM10 | 84967 | 3 | 5 | 22 | |
| GSE20123 | LSM10 | 84967 | 3 | 4 | 23 | |
| GSE43470 | LSM10 | 84967 | 7 | 2 | 34 | |
| GSE46452 | LSM10 | 84967 | 4 | 1 | 54 | |
| GSE47630 | LSM10 | 84967 | 8 | 3 | 29 | |
| GSE54993 | LSM10 | 84967 | 1 | 1 | 68 | |
| GSE54994 | LSM10 | 84967 | 11 | 2 | 40 | |
| GSE60625 | LSM10 | 84967 | 0 | 0 | 11 | |
| GSE74703 | LSM10 | 84967 | 6 | 1 | 29 | |
| GSE74704 | LSM10 | 84967 | 1 | 0 | 19 | |
| TCGA | LSM10 | 84967 | 11 | 18 | 67 |
Total number of gains: 55; Total number of losses: 37; Total Number of normals: 396.
Somatic mutations of LSM10:
Generating mutation plots.
Highly correlated genes for LSM10:
Showing top 20/1370 corelated genes with mean PCC>0.5.
| Gene1 | Gene2 | Mean PCC | Num. Datasets | Num. PCC<0 | Num. PCC>0.5 |
|---|---|---|---|---|---|
| LSM10 | ADH5 | 0.838716 | 3 | 0 | 3 |
| LSM10 | GHDC | 0.821532 | 3 | 0 | 3 |
| LSM10 | HERC2 | 0.809959 | 3 | 0 | 3 |
| LSM10 | KRTCAP2 | 0.796098 | 3 | 0 | 3 |
| LSM10 | PMPCB | 0.789598 | 3 | 0 | 3 |
| LSM10 | ARHGAP24 | 0.783572 | 3 | 0 | 3 |
| LSM10 | PACSIN2 | 0.780356 | 3 | 0 | 3 |
| LSM10 | DHX40 | 0.777771 | 3 | 0 | 3 |
| LSM10 | PLCG1 | 0.772164 | 3 | 0 | 3 |
| LSM10 | MRPL38 | 0.768235 | 4 | 0 | 3 |
| LSM10 | AP3D1 | 0.767297 | 3 | 0 | 3 |
| LSM10 | ORMDL3 | 0.766388 | 3 | 0 | 3 |
| LSM10 | NCAPH2 | 0.764761 | 3 | 0 | 3 |
| LSM10 | ALG10 | 0.764683 | 3 | 0 | 3 |
| LSM10 | CEP290 | 0.760051 | 4 | 0 | 4 |
| LSM10 | DMXL2 | 0.759683 | 3 | 0 | 3 |
| LSM10 | NIPSNAP1 | 0.75704 | 3 | 0 | 3 |
| LSM10 | SLC25A32 | 0.752675 | 5 | 0 | 5 |
| LSM10 | TRIM35 | 0.747819 | 3 | 0 | 3 |
| LSM10 | CHAF1B | 0.745429 | 3 | 0 | 3 |
For details and further investigation, click here