| Full name: thymus, brain and testes associated | Alias Symbol: FLJ32820|spatial | ||
| Type: protein-coding gene | Cytoband: 10q22.1 | ||
| Entrez ID: 219793 | HGNC ID: HGNC:23511 | Ensembl Gene: ENSG00000166220 | OMIM ID: 612640 |
Expression of TBATA:
| Dataset | Gene | EntrezID | Probe | Log2FC | Adj.pValue | Expression |
|---|---|---|---|---|---|---|
| GSE17351 | TBATA | 219793 | 1552887_at | -0.2355 | 0.4483 | |
| GSE26886 | TBATA | 219793 | 1552887_at | -0.0961 | 0.3059 | |
| GSE45670 | TBATA | 219793 | 1552887_at | 0.0359 | 0.6808 | |
| GSE53622 | TBATA | 219793 | 130415 | -0.0412 | 0.5802 | |
| GSE53624 | TBATA | 219793 | 130415 | 0.0742 | 0.2842 | |
| GSE63941 | TBATA | 219793 | 1552887_at | 0.0924 | 0.5112 | |
| GSE77861 | TBATA | 219793 | 1552887_at | -0.1042 | 0.1645 |
Upregulated datasets: 0; Downregulated datasets: 0.
Survival by TBATA expression:
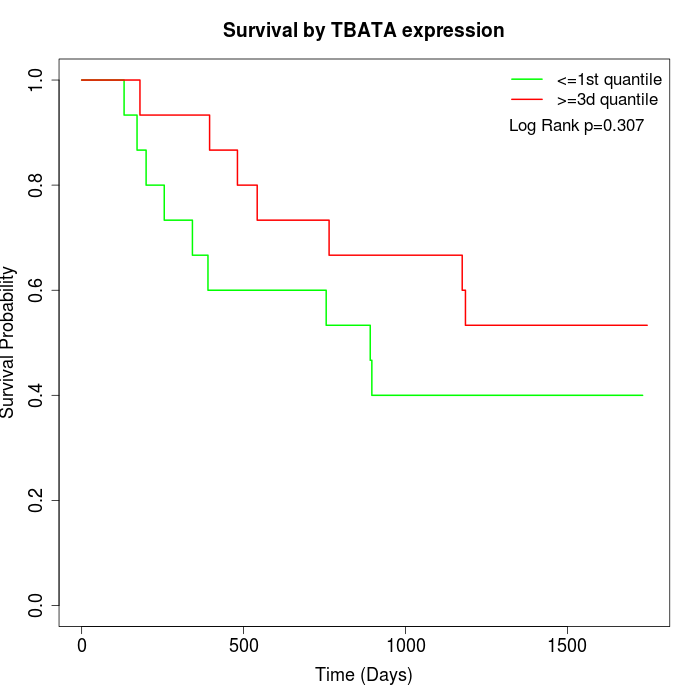 |  |
| GSE53622 | GSE53624 |
Note: Click image to view full size file.
Copy number change of TBATA:
| Dataset | Gene | EntrezID | Gain | Loss | Normal | Detail |
|---|---|---|---|---|---|---|
| GSE15526 | TBATA | 219793 | 2 | 4 | 24 | |
| GSE20123 | TBATA | 219793 | 2 | 3 | 25 | |
| GSE43470 | TBATA | 219793 | 1 | 7 | 35 | |
| GSE46452 | TBATA | 219793 | 0 | 11 | 48 | |
| GSE47630 | TBATA | 219793 | 2 | 14 | 24 | |
| GSE54993 | TBATA | 219793 | 7 | 0 | 63 | |
| GSE54994 | TBATA | 219793 | 2 | 11 | 40 | |
| GSE60625 | TBATA | 219793 | 0 | 0 | 11 | |
| GSE74703 | TBATA | 219793 | 1 | 4 | 31 | |
| GSE74704 | TBATA | 219793 | 1 | 1 | 18 | |
| TCGA | TBATA | 219793 | 10 | 24 | 62 |
Total number of gains: 28; Total number of losses: 79; Total Number of normals: 381.
Somatic mutations of TBATA:
Generating mutation plots.
Highly correlated genes for TBATA:
Showing top 20/73 corelated genes with mean PCC>0.5.
| Gene1 | Gene2 | Mean PCC | Num. Datasets | Num. PCC<0 | Num. PCC>0.5 |
|---|---|---|---|---|---|
| TBATA | OPTC | 0.696206 | 3 | 0 | 3 |
| TBATA | LINGO3 | 0.665162 | 3 | 0 | 3 |
| TBATA | ALLC | 0.664832 | 3 | 0 | 3 |
| TBATA | THPO | 0.640515 | 3 | 0 | 3 |
| TBATA | CCKBR | 0.63287 | 3 | 0 | 3 |
| TBATA | FRRS1L | 0.628691 | 3 | 0 | 3 |
| TBATA | KCNK9 | 0.626049 | 3 | 0 | 3 |
| TBATA | OR10A3 | 0.625668 | 4 | 0 | 4 |
| TBATA | TAS2R39 | 0.622651 | 3 | 0 | 3 |
| TBATA | RTP5 | 0.622502 | 3 | 0 | 3 |
| TBATA | WDR49 | 0.62194 | 3 | 0 | 3 |
| TBATA | TAAR5 | 0.621865 | 4 | 0 | 4 |
| TBATA | SLC26A8 | 0.621333 | 3 | 0 | 3 |
| TBATA | S100G | 0.613299 | 3 | 0 | 3 |
| TBATA | CCDC13 | 0.608077 | 4 | 0 | 3 |
| TBATA | OR4D2 | 0.598587 | 4 | 0 | 4 |
| TBATA | PKD2L1 | 0.594456 | 3 | 0 | 3 |
| TBATA | MROH8 | 0.594387 | 3 | 0 | 3 |
| TBATA | ANHX | 0.593327 | 3 | 0 | 3 |
| TBATA | MTNR1B | 0.587722 | 3 | 0 | 3 |
For details and further investigation, click here