| Full name: transcription factor B1, mitochondrial | Alias Symbol: mtTFB|CGI-75 | ||
| Type: protein-coding gene | Cytoband: 6q25.3 | ||
| Entrez ID: 51106 | HGNC ID: HGNC:17037 | Ensembl Gene: ENSG00000029639 | OMIM ID: 607033 |
Screen Evidence:
| |||
Expression of TFB1M:
| Dataset | Gene | EntrezID | Probe | Log2FC | Adj.pValue | Expression |
|---|---|---|---|---|---|---|
| GSE17351 | TFB1M | 51106 | 228075_x_at | -0.3042 | 0.3643 | |
| GSE20347 | TFB1M | 51106 | 219169_s_at | 0.1667 | 0.3925 | |
| GSE23400 | TFB1M | 51106 | 219169_s_at | 0.1589 | 0.0097 | |
| GSE26886 | TFB1M | 51106 | 228075_x_at | 0.2067 | 0.4322 | |
| GSE29001 | TFB1M | 51106 | 219169_s_at | -0.2135 | 0.4171 | |
| GSE38129 | TFB1M | 51106 | 219169_s_at | 0.2610 | 0.0503 | |
| GSE45670 | TFB1M | 51106 | 219169_s_at | -0.0204 | 0.9312 | |
| GSE53622 | TFB1M | 51106 | 44801 | -0.1874 | 0.0174 | |
| GSE53624 | TFB1M | 51106 | 44801 | -0.0983 | 0.1995 | |
| GSE63941 | TFB1M | 51106 | 228075_x_at | -0.1312 | 0.8162 | |
| GSE77861 | TFB1M | 51106 | 228075_x_at | 0.4301 | 0.0802 | |
| GSE97050 | TFB1M | 51106 | A_23_P93499 | -0.0908 | 0.6337 | |
| SRP007169 | TFB1M | 51106 | RNAseq | 0.7900 | 0.0697 | |
| SRP008496 | TFB1M | 51106 | RNAseq | 1.0572 | 0.0206 | |
| SRP064894 | TFB1M | 51106 | RNAseq | 0.2306 | 0.1289 | |
| SRP133303 | TFB1M | 51106 | RNAseq | 0.1126 | 0.1773 | |
| SRP159526 | TFB1M | 51106 | RNAseq | 0.4957 | 0.2323 | |
| SRP193095 | TFB1M | 51106 | RNAseq | 0.1465 | 0.1819 | |
| SRP219564 | TFB1M | 51106 | RNAseq | -0.0186 | 0.9459 | |
| TCGA | TFB1M | 51106 | RNAseq | 0.0728 | 0.3234 |
Upregulated datasets: 1; Downregulated datasets: 0.
Survival by TFB1M expression:
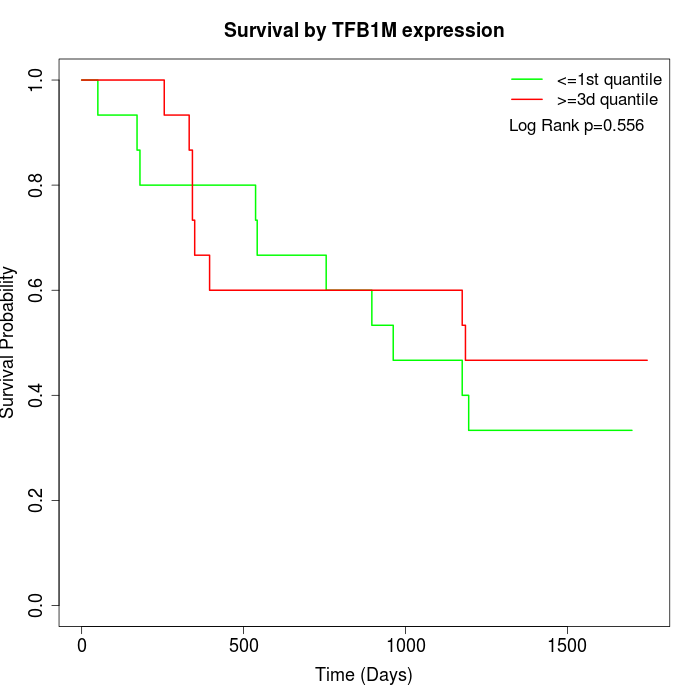 |  |  |
| GSE53622 | GSE53624 | TCGA |
Note: Click image to view full size file.
Copy number change of TFB1M:
| Dataset | Gene | EntrezID | Gain | Loss | Normal | Detail |
|---|---|---|---|---|---|---|
| GSE15526 | TFB1M | 51106 | 1 | 4 | 25 | |
| GSE20123 | TFB1M | 51106 | 1 | 3 | 26 | |
| GSE43470 | TFB1M | 51106 | 4 | 0 | 39 | |
| GSE46452 | TFB1M | 51106 | 3 | 10 | 46 | |
| GSE47630 | TFB1M | 51106 | 9 | 4 | 27 | |
| GSE54993 | TFB1M | 51106 | 3 | 2 | 65 | |
| GSE54994 | TFB1M | 51106 | 8 | 8 | 37 | |
| GSE60625 | TFB1M | 51106 | 0 | 1 | 10 | |
| GSE74703 | TFB1M | 51106 | 4 | 0 | 32 | |
| GSE74704 | TFB1M | 51106 | 0 | 1 | 19 | |
| TCGA | TFB1M | 51106 | 12 | 21 | 63 |
Total number of gains: 45; Total number of losses: 54; Total Number of normals: 389.
Somatic mutations of TFB1M:
Generating mutation plots.
Highly correlated genes for TFB1M:
Showing all 17 correlated genes with mean PCC>0.5.
| Gene1 | Gene2 | Mean PCC | Num. Datasets | Num. PCC<0 | Num. PCC>0.5 |
|---|---|---|---|---|---|
| TFB1M | PRPF31 | 0.762292 | 3 | 0 | 3 |
| TFB1M | PRR15 | 0.747119 | 3 | 0 | 3 |
| TFB1M | PCSK1N | 0.702805 | 3 | 0 | 3 |
| TFB1M | LINC01206 | 0.701409 | 3 | 0 | 3 |
| TFB1M | JAKMIP3 | 0.63086 | 4 | 0 | 3 |
| TFB1M | MCM9 | 0.630508 | 3 | 0 | 3 |
| TFB1M | TULP3 | 0.629482 | 4 | 0 | 3 |
| TFB1M | MPP3 | 0.624996 | 5 | 0 | 4 |
| TFB1M | FREM2 | 0.605762 | 3 | 0 | 3 |
| TFB1M | ARMC7 | 0.594761 | 4 | 0 | 3 |
| TFB1M | SLC25A2 | 0.587237 | 3 | 0 | 3 |
| TFB1M | ABHD11 | 0.561681 | 7 | 0 | 4 |
| TFB1M | ZNF711 | 0.547295 | 5 | 0 | 3 |
| TFB1M | RPL31 | 0.542452 | 4 | 0 | 3 |
| TFB1M | EXOSC7 | 0.531118 | 5 | 0 | 3 |
| TFB1M | PCLO | 0.508475 | 4 | 0 | 3 |
| TFB1M | MUTYH | 0.50576 | 5 | 0 | 3 |
For details and further investigation, click here