| Full name: actin related protein 10 | Alias Symbol: HARP11|ACTR11|Arp11|Arp10 | ||
| Type: protein-coding gene | Cytoband: 14q23.1 | ||
| Entrez ID: 55860 | HGNC ID: HGNC:17372 | Ensembl Gene: ENSG00000131966 | OMIM ID: |
Expression of ACTR10:
| Dataset | Gene | EntrezID | Probe | Log2FC | Adj.pValue | Expression |
|---|---|---|---|---|---|---|
| GSE17351 | ACTR10 | 55860 | 222230_s_at | -0.1228 | 0.8055 | |
| GSE20347 | ACTR10 | 55860 | 222230_s_at | -0.2368 | 0.1360 | |
| GSE23400 | ACTR10 | 55860 | 222230_s_at | -0.0496 | 0.4151 | |
| GSE26886 | ACTR10 | 55860 | 222230_s_at | -0.5708 | 0.0048 | |
| GSE29001 | ACTR10 | 55860 | 222230_s_at | -0.1337 | 0.6074 | |
| GSE38129 | ACTR10 | 55860 | 222230_s_at | -0.1575 | 0.2378 | |
| GSE45670 | ACTR10 | 55860 | 222230_s_at | -0.1701 | 0.1848 | |
| GSE53622 | ACTR10 | 55860 | 40415 | -0.2859 | 0.0039 | |
| GSE53624 | ACTR10 | 55860 | 40415 | -0.3143 | 0.0029 | |
| GSE63941 | ACTR10 | 55860 | 222230_s_at | -0.6810 | 0.0898 | |
| GSE77861 | ACTR10 | 55860 | 222230_s_at | -0.2971 | 0.4711 | |
| GSE97050 | ACTR10 | 55860 | A_33_P3416946 | -0.2117 | 0.3572 | |
| SRP007169 | ACTR10 | 55860 | RNAseq | -1.1195 | 0.0011 | |
| SRP008496 | ACTR10 | 55860 | RNAseq | -0.9420 | 0.0000 | |
| SRP064894 | ACTR10 | 55860 | RNAseq | -0.2029 | 0.1072 | |
| SRP133303 | ACTR10 | 55860 | RNAseq | -0.1034 | 0.5533 | |
| SRP159526 | ACTR10 | 55860 | RNAseq | -0.5473 | 0.0045 | |
| SRP193095 | ACTR10 | 55860 | RNAseq | -0.4087 | 0.0020 | |
| SRP219564 | ACTR10 | 55860 | RNAseq | -0.1779 | 0.6193 | |
| TCGA | ACTR10 | 55860 | RNAseq | 0.0193 | 0.7045 |
Upregulated datasets: 0; Downregulated datasets: 1.
Survival by ACTR10 expression:
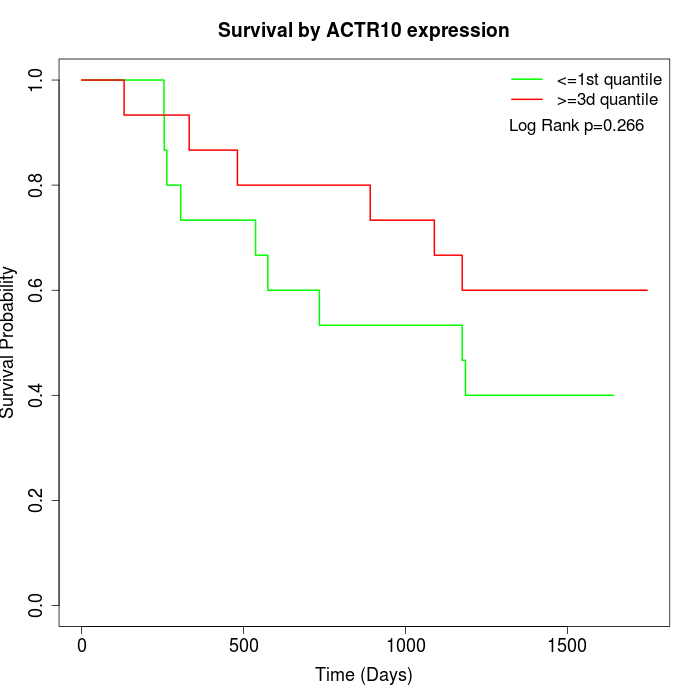 | 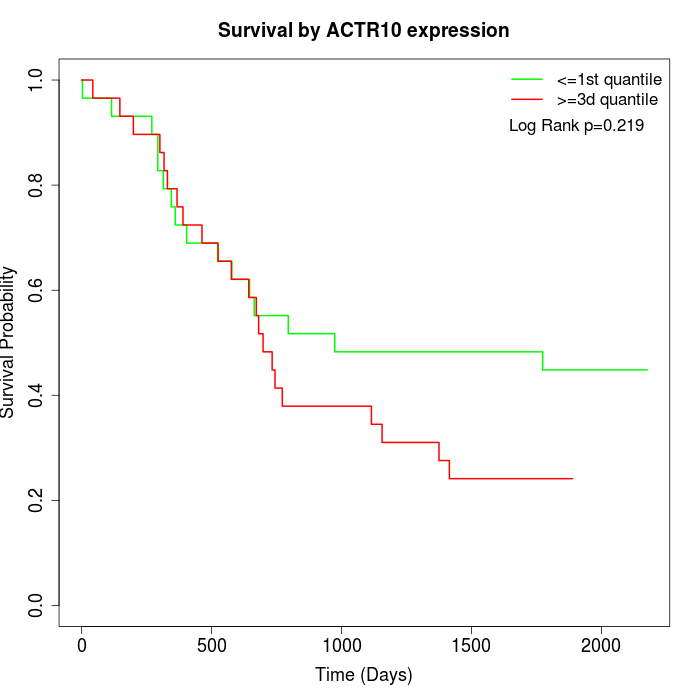 | 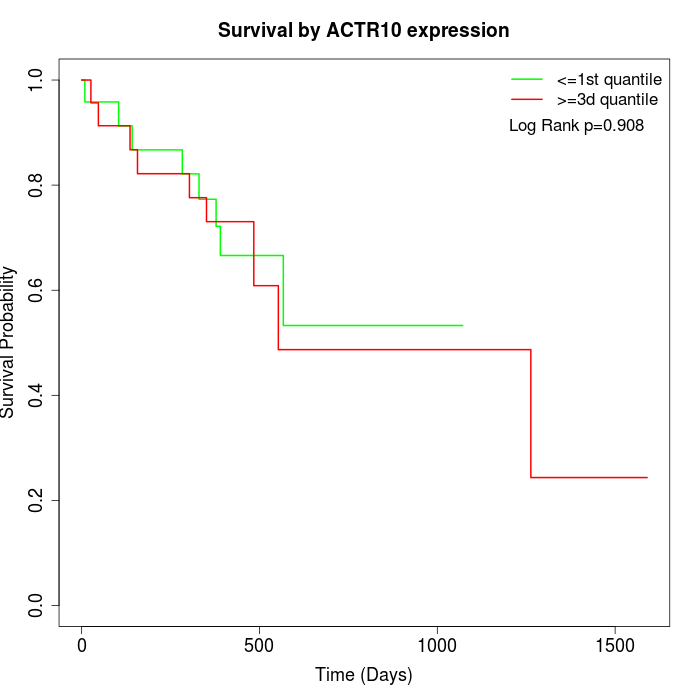 |
| GSE53622 | GSE53624 | TCGA |
Note: Click image to view full size file.
Copy number change of ACTR10:
| Dataset | Gene | EntrezID | Gain | Loss | Normal | Detail |
|---|---|---|---|---|---|---|
| GSE15526 | ACTR10 | 55860 | 8 | 3 | 19 | |
| GSE20123 | ACTR10 | 55860 | 7 | 3 | 20 | |
| GSE43470 | ACTR10 | 55860 | 8 | 2 | 33 | |
| GSE46452 | ACTR10 | 55860 | 16 | 3 | 40 | |
| GSE47630 | ACTR10 | 55860 | 11 | 10 | 19 | |
| GSE54993 | ACTR10 | 55860 | 3 | 8 | 59 | |
| GSE54994 | ACTR10 | 55860 | 19 | 4 | 30 | |
| GSE60625 | ACTR10 | 55860 | 0 | 2 | 9 | |
| GSE74703 | ACTR10 | 55860 | 7 | 2 | 27 | |
| GSE74704 | ACTR10 | 55860 | 3 | 2 | 15 | |
| TCGA | ACTR10 | 55860 | 33 | 13 | 50 |
Total number of gains: 115; Total number of losses: 52; Total Number of normals: 321.
Somatic mutations of ACTR10:
Generating mutation plots.
Highly correlated genes for ACTR10:
Showing top 20/61 corelated genes with mean PCC>0.5.
| Gene1 | Gene2 | Mean PCC | Num. Datasets | Num. PCC<0 | Num. PCC>0.5 |
|---|---|---|---|---|---|
| ACTR10 | UPF2 | 0.718628 | 3 | 0 | 3 |
| ACTR10 | ZNF396 | 0.664293 | 3 | 0 | 3 |
| ACTR10 | SNX21 | 0.663907 | 3 | 0 | 3 |
| ACTR10 | ACADS | 0.654007 | 3 | 0 | 3 |
| ACTR10 | VCPKMT | 0.645203 | 3 | 0 | 3 |
| ACTR10 | RWDD3 | 0.631168 | 3 | 0 | 3 |
| ACTR10 | ACYP2 | 0.62551 | 3 | 0 | 3 |
| ACTR10 | CMTR2 | 0.624065 | 3 | 0 | 3 |
| ACTR10 | VIPAS39 | 0.62131 | 6 | 0 | 5 |
| ACTR10 | ACTR8 | 0.617257 | 3 | 0 | 3 |
| ACTR10 | ZNF30 | 0.6123 | 3 | 0 | 3 |
| ACTR10 | ABHD13 | 0.610837 | 4 | 0 | 4 |
| ACTR10 | CIPC | 0.608233 | 3 | 0 | 3 |
| ACTR10 | STRIP1 | 0.602927 | 3 | 0 | 3 |
| ACTR10 | TRAPPC11 | 0.596222 | 4 | 0 | 3 |
| ACTR10 | RPL22 | 0.593858 | 4 | 0 | 3 |
| ACTR10 | CMAS | 0.593814 | 3 | 0 | 3 |
| ACTR10 | TTC1 | 0.593374 | 5 | 0 | 4 |
| ACTR10 | DNAJB2 | 0.585829 | 4 | 0 | 3 |
| ACTR10 | RBM48 | 0.584015 | 4 | 0 | 3 |
For details and further investigation, click here