| Full name: AKNA domain containing 1 | Alias Symbol: MGC26989 | ||
| Type: protein-coding gene | Cytoband: 1p13.3 | ||
| Entrez ID: 254268 | HGNC ID: HGNC:28398 | Ensembl Gene: ENSG00000162641 | OMIM ID: |
Expression of AKNAD1:
| Dataset | Gene | EntrezID | Probe | Log2FC | Adj.pValue | Expression |
|---|---|---|---|---|---|---|
| GSE17351 | AKNAD1 | 254268 | 1558834_s_at | -0.3074 | 0.7648 | |
| GSE26886 | AKNAD1 | 254268 | 1563834_a_at | -0.0326 | 0.8034 | |
| GSE45670 | AKNAD1 | 254268 | 1563834_a_at | -0.2408 | 0.0140 | |
| GSE53622 | AKNAD1 | 254268 | 77148 | -0.5026 | 0.0005 | |
| GSE53624 | AKNAD1 | 254268 | 42176 | -0.7264 | 0.0000 | |
| GSE63941 | AKNAD1 | 254268 | 1552933_at | 0.0081 | 0.9732 | |
| GSE77861 | AKNAD1 | 254268 | 1563834_a_at | -0.0459 | 0.7040 | |
| GSE97050 | AKNAD1 | 254268 | A_33_P3241081 | -0.4626 | 0.1985 | |
| SRP064894 | AKNAD1 | 254268 | RNAseq | -0.0683 | 0.8773 | |
| SRP133303 | AKNAD1 | 254268 | RNAseq | -0.9036 | 0.0455 | |
| SRP159526 | AKNAD1 | 254268 | RNAseq | -3.8180 | 0.0000 | |
| SRP219564 | AKNAD1 | 254268 | RNAseq | -1.5319 | 0.0244 | |
| TCGA | AKNAD1 | 254268 | RNAseq | 0.6209 | 0.3589 |
Upregulated datasets: 0; Downregulated datasets: 2.
Survival by AKNAD1 expression:
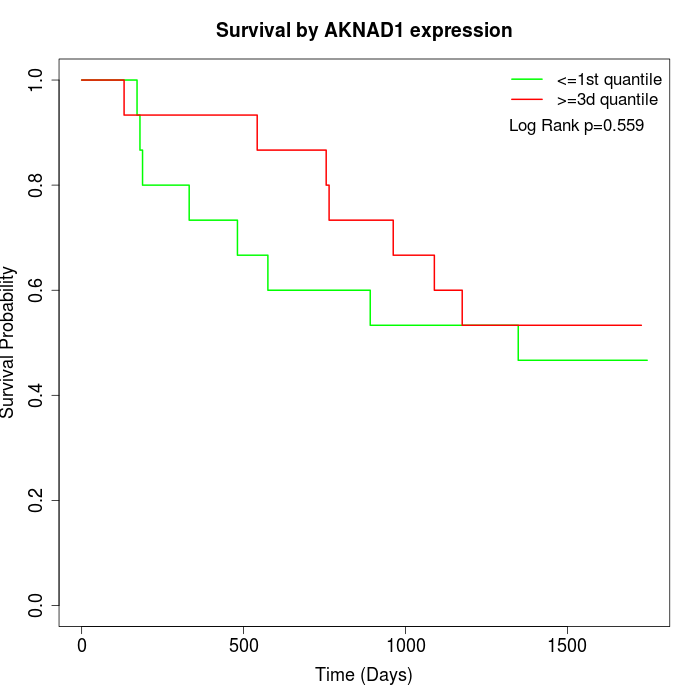 | 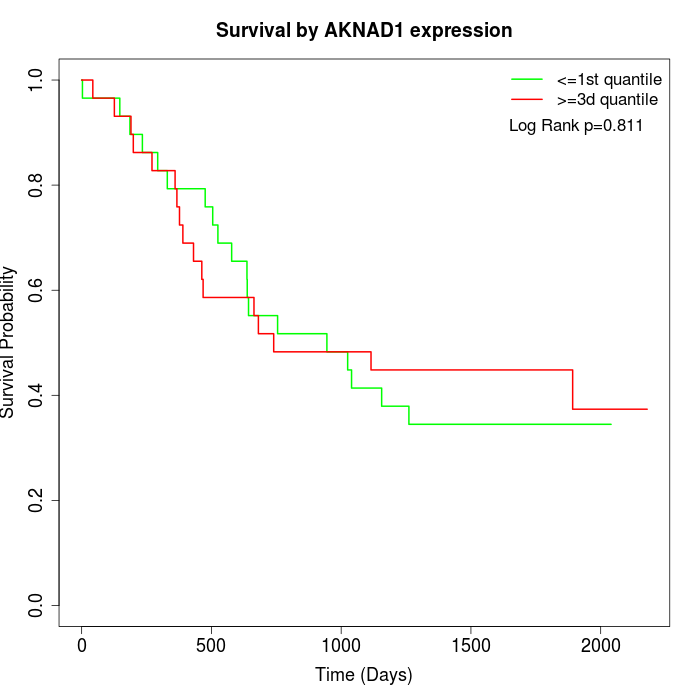 | 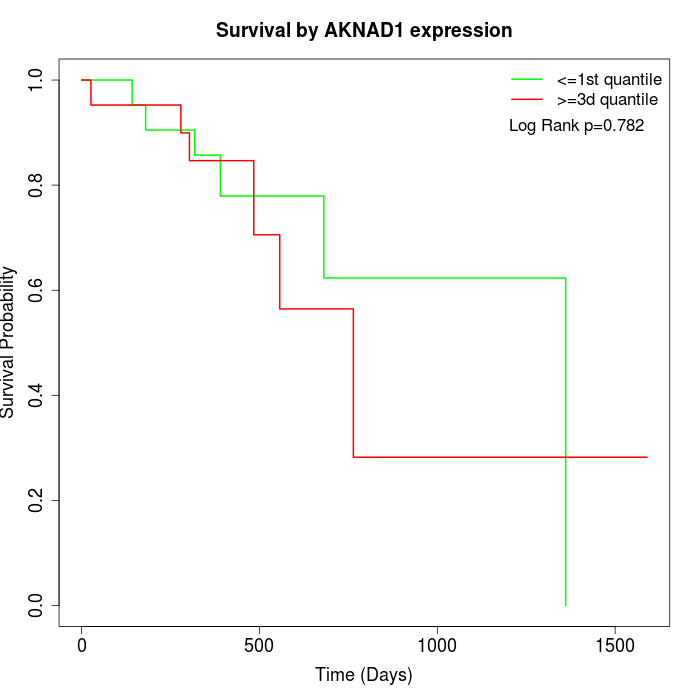 |
| GSE53622 | GSE53624 | TCGA |
Note: Click image to view full size file.
Copy number change of AKNAD1:
| Dataset | Gene | EntrezID | Gain | Loss | Normal | Detail |
|---|---|---|---|---|---|---|
| GSE15526 | AKNAD1 | 254268 | 0 | 12 | 18 | |
| GSE20123 | AKNAD1 | 254268 | 0 | 11 | 19 | |
| GSE43470 | AKNAD1 | 254268 | 0 | 8 | 35 | |
| GSE46452 | AKNAD1 | 254268 | 2 | 1 | 56 | |
| GSE47630 | AKNAD1 | 254268 | 9 | 5 | 26 | |
| GSE54993 | AKNAD1 | 254268 | 0 | 1 | 69 | |
| GSE54994 | AKNAD1 | 254268 | 7 | 4 | 42 | |
| GSE60625 | AKNAD1 | 254268 | 0 | 0 | 11 | |
| GSE74703 | AKNAD1 | 254268 | 0 | 6 | 30 | |
| GSE74704 | AKNAD1 | 254268 | 0 | 7 | 13 | |
| TCGA | AKNAD1 | 254268 | 8 | 26 | 62 |
Total number of gains: 26; Total number of losses: 81; Total Number of normals: 381.
Somatic mutations of AKNAD1:
Generating mutation plots.
Highly correlated genes for AKNAD1:
Showing all 15 correlated genes with mean PCC>0.5.
| Gene1 | Gene2 | Mean PCC | Num. Datasets | Num. PCC<0 | Num. PCC>0.5 |
|---|---|---|---|---|---|
| AKNAD1 | AVPR2 | 0.594189 | 3 | 0 | 3 |
| AKNAD1 | GPSM2 | 0.5708 | 5 | 0 | 4 |
| AKNAD1 | FOXP2 | 0.568949 | 3 | 0 | 3 |
| AKNAD1 | ARHGAP10 | 0.566559 | 5 | 0 | 3 |
| AKNAD1 | TUBB6 | 0.558155 | 4 | 0 | 4 |
| AKNAD1 | LTBP4 | 0.553572 | 4 | 0 | 3 |
| AKNAD1 | CRCT1 | 0.552298 | 4 | 0 | 3 |
| AKNAD1 | SNORA74A | 0.549484 | 4 | 0 | 3 |
| AKNAD1 | SLC22A18AS | 0.539911 | 4 | 0 | 3 |
| AKNAD1 | CCDC185 | 0.532961 | 3 | 0 | 3 |
| AKNAD1 | AHNAK | 0.525974 | 5 | 0 | 3 |
| AKNAD1 | NMUR1 | 0.523878 | 4 | 0 | 3 |
| AKNAD1 | CIDEA | 0.514565 | 5 | 0 | 4 |
| AKNAD1 | DAAM1 | 0.509679 | 4 | 0 | 3 |
| AKNAD1 | PTH1R | 0.50153 | 5 | 0 | 3 |
For details and further investigation, click here